Download
1 / 14
140 likes | 251 Vues
This report presents an analysis of the economic impact of responsible tourism practices, focusing on key metrics such as job security, employee demographics, and local purchasing patterns. It highlights the importance of transparency in reporting, showcasing significant achievements in sustainable tourism. Relevant case studies, including the Tiger Mountain Pokhara Lodge, illustrate trends in job creation, fair salaries, and charitable donations within the industry. The report aims to set realistic benchmarks, encouraging continuous development and shared learning across tourism destinations.

E N D
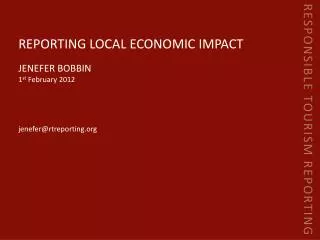
Reporting Local Economic Impact JENEFER BOBBIN 1st February 2012 RESPONSIBLE TOURISM REPORTING jenefer@rtreporting.org
Reporting & Transparency ONE SIZE DOESN’T FIT ALL • social as well as environmental monitoring • tailored industry and destination indicators • individual priorities TRANSPARANCY • highlights achievement • creates viable shared learning platforms RESPONSIBLE TOURISM REPORTING PROCESS verses PERFORMANCE • allows a business to respond to sustainability issues more accurately COMMITMENT TO DELIVER • TUI & Thomas Cook are reporting using the GRI G3 Reporting Framework
REPORTING INITIATIVES RESPONSIBLE TOURISM REPORTING
JOB SECURITY PERCENTAGE BREAKDOWN OF PERMANENT & CASUAL EMPLOYEES 82% permanent 67% permanent 63% permanent RESPONSIBLE TOURISM REPORTING 2008-09 2009-10 2010-11 71% permanent 80% permanent Pilot Study Average Tiger Mountain Pokhara Lodge 3-year Average
Fair Salaries PERMANENT STAFF SALARIES AS A PERCENTAGE ABOVE THE MINIMUM WAGE 415% 347% 368% 313% 253% 214% 225% 171% 177% 143% 159% 145% RESPONSIBLE TOURISM REPORTING median paid employee highest paid employee lowest paid employee 443% 443% 400% 2008-09 – minimum wage / salary / bonuses / tips 2009-10 – minimum wage / salary / bonuses / tips 2010-11 – minimum wage / salary / bonuses / tips 2010-11 Pilot Study Average – minimum wage / salary / bonuses / tips N/A managing director
Local Employment PERCENTAGE BREAKDOWN OF LOCAL, NATIONAL & INTERNATIONAL EMPLOYEES 58% national 58% national 59% national 40% local 40% local 38% local RESPONSIBLE TOURISM REPORTING 2008-09 2009-10 2010-11 32% national 58% national 39% local 67% local Pilot Study Average Tiger Mountain Pokhara Lodge 3-year Average
FEMALE Employment PERCENTAGE BREAKDOWN OF FEMALE & FEMALE EMPLOYEES 5% female 5% female 5% female RESPONSIBLE TOURISM REPORTING 2008-09 2009-10 2010-11 5% female 10% female Pilot Study Average Tiger Mountain Pokhara Lodge 3-year Average
EMPLOYEE EQUALITY PERCENTAGE BREAKDOWN OF LOCAL, NATIONAL & INTERNATIONAL SALARIES 60% national 59% national 61% national 58% national 58% national 59% national 40% local 40% local 38% local 35% local 37% local 36% local RESPONSIBLE TOURISM REPORTING 2008-09 2008-09 2009-10 2009-10 2010-11 2010-11 32% national 60% national 34% national 58% national 39% local 67% local 36% local 65% local Pilot Study Average Pilot Study Average Tiger Mountain Pokhara Lodge 3-year Average Tiger Mountain Pokhara Lodge 3-year Average
Purchasing PERCENTAGE BREAKDOWN OF LOCAL, NATIONAL & INTERNATIONAL PURCHASING 3% local 98% national 88% national 89% national RESPONSIBLE TOURISM REPORTING 2008-09 2009-10 2010-11 1% local 36% national Tiger Mountain Pokhara Lodge 3-year Average
Charity TOTAL YEARLY CHARITABLE DONATIONS IN NPR 875,874 2008-09 800,448 2009-10 478,307 467,329 2010-11 370,668 178,655 138,030 RESPONSIBLE TOURISM REPORTING 0 0 facilitated monetary & staff time in-kind PERCENTAGE BREAKDOWN OF LOCAL, NATIONAL & INTERNATIONAL CHARITY 19% local 21% local 57% local 32% national 42% national 39% national 2008-09 2009-10 2010-11
SHARED VALUE PERCENTAGE BREAKDOWN OF LOCAL, NATIONAL & INTERNATIONAL SPENDING 11% international 19% local 21% local 42% international 37% international 32% national 39% national 42% national 57% local RESPONSIBLE TOURISM REPORTING 2008-09 2009-10 2010-11
Total VALUE invested in the Local Region 9,677,561 NPR over 3 year 4,400,231 NPR in 2010/11 56 teachers annual salaries RESPONSIBLE TOURISM REPORTING 125 x GNI per capita 2009/10
What’s in it for the World? BENCHMARKING • sets realistic goals • provides measurable outcomes REPORTING • adds transparency • stimulates continual development • provides destination aggregated information RESPONSIBLE TOURISM REPORTING THE FUTURE • high levels of initial interest • library of publicly available reports • increase number of reporting businesses
THANK YOU RESPONSIBLE TOURISM REPORTING jenefer@rtreporting.org