Download
1 / 15
160 likes | 190 Vues
Explore the definitions of stellar spectroscopy and elemental abundances, including solar and relative abundances, origin of elements, and metallicity concepts. Discover the significance of various elements, from hydrogen to the iron group, and the processes that shape their abundance in stars. Learn about the impact of nucleosynthesis mechanisms like the s-process and r-process on element formation. Access detailed information on abundance trends among stars and the evolution of elemental compositions over time in the galaxy.

E N D
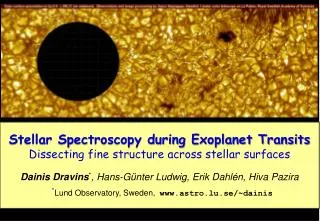
Stellar Spectroscopy and Elemental Abundances Definitions Solar Abundances Relative Abundances Origin of Elements
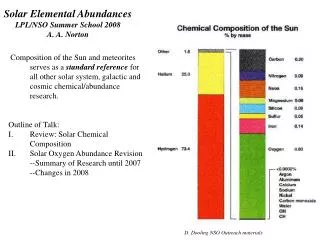
Definitions • X, Y, Z: amounts of H, He, and rest (metals) by mass (total of 1; log Z/Zsun in Kurucz models) • Solar: X=0.735, Y=0.248, Z=0.017 • Abundance as number density relative to HA=N(element)/N(H)Usually given as log A or log A +12 • [Fe/H]=log[N(Fe)/N(H)]star – log[N(Fe)/N(H)]sun • [M/H] sometimes reported as mean metallicity
Solar Abundances • From spectroscopy and meteorites • Gray Table 16.3 • Scott, Grevesse et al.2015, A&A, 573, A252014arXiv1405.0279S
Origin of the Elementshttp://ned.ipac.caltech.edu/level5/Pagel/Pagel_contents.html • Hydrogen is most abundant element, followed fairly closely by helium. • He formed in the Big Bang, with some increase from the primordial He abundance (Yp =0.24) by subsequent H-burning in stars (Y = 0.248 here and now).
Light Elements: Li, Be, B • Li, Be and B are very scarce, mostly destroyed in the harsh environment of stellar interiors • Li abundance comes from measurements in meteorites; it is still lower in the solar photosphere because of destruction by mixing with hotter layers below. • Abundant in primary cosmic rays as a result of fusion and spallation reactions between p and (mainly) CNO nuclei at high energies. • Deuterium and some Li formed in Big Bang.
Carbon (6) to Calcium (20) • Downward progression modulated by odd:even and shell effects in nuclei which affect their binding energy. • From successive stages in stellar evolution: exhaustion of one fuel is followed by contraction, heating, alpha=He capture fusion. • Onset of Ca burning leads to Mg and nearby elements; accompanied by neutrino emission(ever faster evolution).
Iron Group • Fe-group elements represent approximate nuclear statistical equilibrium at T ≈109 K • Result of shock that emerges from the core of a massive star that has collapsed into a neutron star (SN II) OR sudden ignition of C in a white dwarf that has accreted enough material from a companion to bring it over the Chandrasekhar mass limit (SN Ia). • Dominant product is 56Ni, most stable nucleus with equal numbers of protons and neutrons, which later decays into 56Fe.
s-process: slow addition of neutrons • Nucleosynthesis beyond the Fe group occurs by neutron capture. Captures on a seed nucleus (mostly 56Fe) lead to the production of a β-unstable nucleus (e.g. 59Fe). • Outcome depends on relative time-scales for neutron addition and decay. • s-process: slow addition, so that unstable nuclei have time to undergo decay • Nuclei form along the stability valley to 209Bi.
r-process: rapid addition of neutrons • Many neutrons are added under conditions of very high T, neutron density; build unstable nuclei up to the point where (n, γ) captures are balanced by (γ, n) photodisintegrations • After neutron supply is switched off, products undergo further decay ending at the nearest stable isobar (neutron-rich side of the stability valley). • Some elements from both r- and s-processes.
Stability Valley Abundance peaks occur corresponding to closed shells with 50, 82 or 126 neutrons
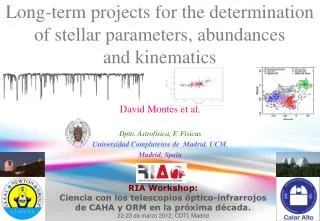
Metal rich vs. metal poor stars:Frebel et al.2005, Nature, 434, 871[Fe/H]=-5.4 • SMSS0313-6708[Fe/H]<-6.5Nordlander et al.2017, A&A, 597, A6
Abundance Trends • Metals higher in Pop I stars (younger, disk) than in Pop II stars (older, halo);Galactic enrichment with time • Metals higher closer to Galactic center • Evolutionary changes:Li decrease with ageCNO-processed gas in stars with mixingC enhancement in older stars with He-burning • Magnetic fields can create patches with unusual abundance patterns: Ap stars