Stellar Spectroscopy during Exoplanet Transits
200 likes | 393 Vues
KVA. Stellar Spectroscopy during Exoplanet Transits Dissecting fine structure across stellar surfaces Dainis Dravins * , Hans-Günter Ludwig, Erik Dahlén, Hiva Pazira * Lund Observatory , Sweden, www.astro.lu.se /~dainis. STELLAR SURFACES.

Stellar Spectroscopy during Exoplanet Transits
E N D
Presentation Transcript
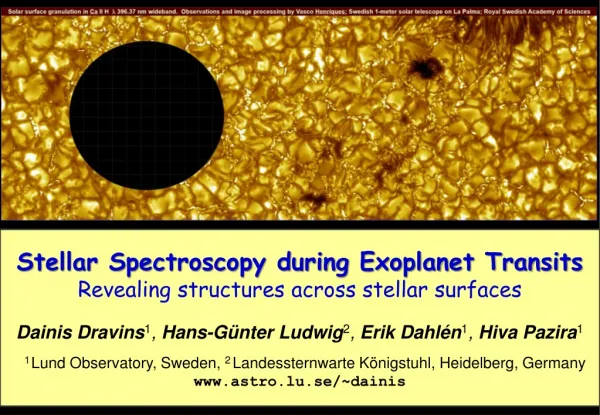
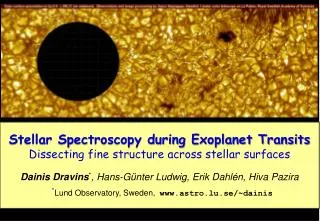
KVA Stellar Spectroscopy during Exoplanet Transits Dissecting fine structure across stellar surfaces Dainis Dravins*, Hans-Günter Ludwig, Erik Dahlén, Hiva Pazira *Lund Observatory, Sweden, www.astro.lu.se/~dainis
STELLAR SURFACES Simulations feasible for widely different stars But … any precise physical conclusion depends on the reliability of modeling (metallicity, magnetic activity, gravitational redshift, center-to-limb wavelength changes) How does one verify/falsify 3-D simulations (except for the spatially resolved Sun) ? High-resolution spectroscopy across spatially resolved stellar disks! Granulation on a 12,000 K white dwarf (top) and a 3,800 K red giant. Areas differ by enormous factors: 7x7 km2 for the white dwarf, and 23x23 RSun2 for the giant. (H.-G. Ludwig, Heidelberg)
Spatially resolving stellar surfaces Hiva Pazira, MSc thesis, Lund Observatory (2012)
Stellar Spectroscopy during Exoplanet Transits * Exoplanets successively hide segments of stellar disk * Differential spectroscopy provides spectra of those surface segments that were hidden behind the planet * 3-D hydrodynamics studied in center-to-limb variations of line shapes, asymmetries and wavelength shifts * With sufficient S/N, also spectra of surface features such as starspots may become attainable
Spectral line hidden by exoplanet (Rapidly rotating solar model; noise and limited spectral resolution) Hiva Pazira, MSc thesis, Lund Observatory (2012)
Line profiles from 3-D Hydrodynamic simulations Model predictions insensitive to modest spatial smearing Spatially averaged line profiles from 20 timesteps, and temporal averages. = 620 nm = 3 eV 5 line strengths GIANT STAR Teff= 5000 K log g [cgs] = 2.5 (approx. K0 III) Stellar disk center; µ = cos = 1.0 (Models by Hans-Günter Ludwig, Landessternwarte Heidelberg)
Synthetic line profiles across stellar disks (Adapted from calculations by Hans-Günter Ludwig, Landessternwarte Heidelberg) Profiles from CO5BOLD solar model; Five line strengths; three excitation potentials. Left: Solar disk center. Right: Disk position µ = cos = 0.59.
Bisectors of the same spectral line in different stars Adapted from Dravins & Nordlund, A&A 228, 203 From left: Procyon (F5 IV-V), Beta Hyi (G2 IV), Alpha Cen A (G2 V), Alpha Cen B (K1 V). In stars with “corrugated” surfaces, convective blueshifts increase towards the stellar limb Velocity [m/s]
Spectral line profiles across stellar disks Spectral lines, spatially and temporally averaged from 3-D models, change their strengths, widths, asymmetries and convective wavelength shifts across stellar disks, revealing details of atmospheric structure. These line profiles from disk center (µ = cos = 1) towards the limb are from a CO5BOLD model of a main-sequence star; solar metallicity, Teff = 6800 K. (Hans-Günter Ludwig)
Simulated line changes during exoplanet transit Line profile changes during exoplanet transit. Red: Ratios of line profiles relative to the profile outside transit. This simulation sequence from a CO5BOLD model predicts the behavior of an Fe I line ( 620 nm, = 3 eV) during the first half of a transit across the stellar equator by a bloated Jupiter-size exoplanet moving in a prograde orbit, covering 2% of a main-sequence star with solar metallicity, Teff = 6300 K, rotating with Vsini = 5 km/s.
Simulated Rossiter-McLaughlin effect Apparent radial velocity during transit (Rossiter-McLaughlin effect). Wavelengths (here Gaussian fits to synthetic line profiles) are shorter than laboratory values due to convective blueshift. Curves before and after mid-transit (µ = 0.21, 0.59, 0.87) are not exact mirror images due to intrinsic stellar line asymmetries. This simulation from a CO5BOLD model predicts the behavior of an Fe I line ( 620 nm, = 3 eV) during a transit across the stellar equator by a bloated Jupiter-size exoplanet moving in a prograde orbit, covering 2% of a main-sequence star with solar metallicity, Teff = 6300 K, rotating with Vsini = 5 km/s.
Observations with current facilities For a few bright host stars, already current facilities, such as UVES @ VLT, permit reconstructions of stellar surface spectra, also for single stronger lines. Signatures of weaker photospheric lines require averaging over many similar ones. Improved possibilities will come once ongoing exoplanet searches find more transiting planets with bright host stars.
Observations with current facilities For a few bright host stars, already current facilities, such as UVES @ VLT, permit reconstructions of stellar surface spectra, also for single stronger lines. Signatures of weaker photospheric lines require averaging over many similar ones. Improved possibilities will come once ongoing exoplanet searches find more transiting planets with bright host stars.
Observations with current facilities For a few bright host stars, already current facilities, such as UVES @ VLT, permit reconstructions of stellar surface spectra, also for single stronger lines. Signatures of weaker photospheric lines require averaging over many similar ones. Improved possibilities will come once ongoing exoplanet searches find more transiting planets with bright host stars.
Observations with current facilities For a few bright host stars, already current facilities, such as UVES @ VLT, permit reconstructions of stellar surface spectra, also for single stronger lines. Signatures of weaker photospheric lines require averaging over many similar ones. Improved possibilities will come once ongoing exoplanet searches find more transiting planets with bright host stars.
Stellar Spectroscopy during Exoplanet Transits * Now: Marginally feasible with, e.g., UVES @ VLT * Immediate future: PEPSI @ LBT * Near future: ESPRESSO @ VLT * Future: HIRES @ E-ELT ? Anytime soon: More exoplanets transiting bright stars
Exoplanet transit geometries G.Torres, J.Winn, M.J.Holman: Improved Parameters for Extrasolar Transiting Planets, ApJ 677, 1324, 2008
Work plan – HD 209458 HD 209458 selected as the most promising star for resolving spectral differences across stellar surface. Spectral type: G0 V (F9V, G0V) Teff = 6100 K (6082, 6099, 6118 ± 25 K) log g [cgs] = 4.50 (± 0.04) [Fe/H] = 0 (- 0.06, + 0.03 ± 0.02) Vrot = 4.5 (± 0.5 km/s); slow rotator, comparable to Sun sin i = 1 if the star rotates in same plane as transiting planet Sufficiently similar to Sun for same spectral identifications. Somewhat hotter, lines somewhat weaker, less blending. Large planet: Bloated hot Jupiter, R = 1.38 RJup. More vigorous convection for line differences to be detectable? Synthetic spectra for 5900 and 6250 K, log gcgs = 4.5, [Fe/H]= 0.