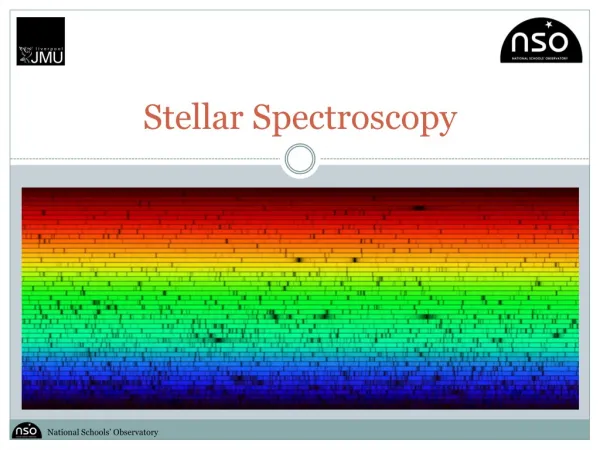
Stellar Spectroscopy
Stellar spectroscopy reveals the unique spectral lines of each element, crucial for studying celestial bodies. The Balmer Series outlines the four visible wavelengths of light emitted by glowing hydrogen gas. "Rest wavelengths" refer to the normal wavelengths when the observed galaxy is stationary. By measuring the hydrogen spectral shifts, we utilize a formula to calculate the redshift (Z), which is then multiplied by the speed of light to determine the object's velocity—indicating whether it's moving away (redshift) or towards us (blueshift). A negative Z denotes a blueshift.

Stellar Spectroscopy
E N D
Presentation Transcript
Each element has its own distinct group of spectral lines which is called its_______________________________. • The table below shows the Balmer Series for the Rest Wavelengths of Hydrogen.
The _______________Series are the 4 visible wavelengths of light given off by glowing hydrogen gas. • ________________Wavelengths means the normal wavelengths of light when the object/galaxy being measured is sitting still (at rest).
The wavelengths of the hydrogen spectral shift are determined for ______and _______ and these wavelengths are compared to the Balmer series above. • Differences are place in formula: _____________________________________ • Z is determined and multiplied by speed of light _____ to indicated speed of redshift or blueshift. • Please note a negative Z indicates blueshift.