Figure 20.2
2. 1. 3. 4. Bacterium. Gene inserted into plasmid. Cell containing gene of interest. Bacterial chromosome. Plasmid. Gene of interest. Recombinant DNA (plasmid). DNA of chromosome (“foreign” DNA). Plasmid put into bacterial cell. Figure 20.2. Recombinant bacterium.
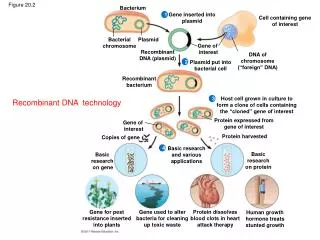

Figure 20.2
E N D
Presentation Transcript
2 1 3 4 Bacterium Gene inserted intoplasmid Cell containing geneof interest Bacterialchromosome Plasmid Gene of interest RecombinantDNA (plasmid) DNA ofchromosome(“foreign” DNA) Plasmid put intobacterial cell Figure 20.2 Recombinantbacterium Recombinant DNA technology Host cell grown in culture toform a clone of cells containingthe “cloned” gene of interest Protein expressed fromgene of interest Gene of interest Protein harvested Copies of gene Basic researchand variousapplications Basicresearchon protein Basic research on gene Gene for pestresistance insertedinto plants Gene used to alterbacteria for cleaningup toxic waste Protein dissolvesblood clots in heartattack therapy Human growthhormone treatsstunted growth
1 Restriction site 5 3 GAATTC DNA CTTAAG 5 3 Restriction enzymecuts sugar-phosphatebackbones. 5 3 3 5 AATTC G CTTAA Figure 20.3-1 G 5 Sticky end 3 5 3
1 2 Restriction site 5 3 GAATTC DNA CTTAAG 5 3 Restriction enzymecuts sugar-phosphatebackbones. 5 3 3 5 AATTC G CTTAA Figure 20.3-2 G 5 Sticky end 3 5 3 5 3 AATTC G G CTTAA DNA fragment addedfrom another moleculecut by same enzyme.Base pairing occurs. 3 5 5 3 5 3 5 3 G AATT C G AATT C C TTAA G G C TTAA 3 5 3 5 5 3 One possible combination
1 2 3 Restriction site 5 3 GAATTC DNA CTTAAG 5 3 Restriction enzymecuts sugar-phosphatebackbones. 5 3 3 5 AATTC G CTTAA Figure 20.3-3 G 5 Sticky end 3 5 3 5 3 AATTC G G CTTAA DNA fragment addedfrom another moleculecut by same enzyme.Base pairing occurs. 3 5 5 3 5 3 5 3 G AATT C G AATT C C TTAA G G C TTAA 3 5 3 5 5 3 One possible combination DNA ligaseseals strands 5 3 3 5 Recombinant DNA molecule
TECHNIQUE Agrobacterium tumefaciens Tiplasmid Figure 20.26 Site whererestrictionenzyme cuts T DNA DNA withthe geneof interest RESULTS RecombinantTi plasmid Plant with new trait
Adultstem cells Embryonicstem cells Cells generatingsome cell types Cells generatingall embryoniccell types Figure 20.21 Culturedstem cells Differentcultureconditions Livercells Bloodcells Nervecells Differenttypes ofdifferentiatedcells
2 1 3 4 Remove skin cellsfrom patient. Reprogram skin cellsso the cells becomeinduced pluripotentstem (iPS) cells. Figure 20.22 Patient withdamaged hearttissue or otherdisease Treat iPS cells sothat they differentiateinto a specificcell type. Return cells topatient, wherethey can repairdamaged tissue.
2 1 3 4 Cloned gene Insert RNA version of normal alleleinto retrovirus. Viral RNA Let retrovirus infect bone marrow cellsthat have been removed from thepatient and cultured. Figure 20.23 Retroviruscapsid Viral DNA carrying the normalallele inserts into chromosome. Bonemarrowcell frompatient Bonemarrow Inject engineeredcells into patient.
Gene marker identification through SNPs DNA Figure 20.16 T Normal allele SNP C Disease-causingallele
Wild-type hemoglobin Sickle-cell hemoglobin Mutant hemoglobin DNA Wild-type hemoglobin DNA Figure 17.23 C C T A T T 5 3 5 3 T G G A A A 5 3 5 3 mRNA mRNA U G A G A A 5 3 5 3 Normal hemoglobin Sickle-cell hemoglobin Val Glu
(a) Electrophoresis of restrictionfragments from normal andsickle-cell alleles (b) DdeI restriction sites in normal andsickle-cell alleles of the -globin gene Normal -globin allele Sickle-cellallele Normalallele Figure 20.10 175 bp Large fragment 201 bp Largefragment DdeI DdeI DdeI DdeI Sickle-cell mutant -globin allele 376 bp 201 bp 376 bp Large fragment 175 bp DdeI DdeI DdeI
Gene marker identification through RFLP RFLP marker DNA LE 20-15 Disease-causing allele Restriction sites Normal allele
(a) This photo showsWashington just beforehis release in 2001,after 17 years in prison. These and other STR data exonerated Washingtonand led Tinsley to plead guilty to the murder. (b) Figure 20.25 Source ofsample STRmarker 3 STRmarker 1 STRmarker 2 17,19 Semen on victim 12,12 13,16 Earl Washington 11,12 16,18 14,15 Kenneth Tinsley 12,12 17,19 13,16
1 2 3 3 5 TECHNIQUE Targetsequence 5 Genomic DNA 3 5 Denaturation 3 PCR Polymerase chain reaction 5 3 Figure 20.8 Annealing Cycle 1yields2molecules Primers Extension Newnucleotides Cycle 2yields4molecules Cycle 3yields 8molecules;2 molecules(in white boxes)match targetsequence
2 1 3 4 TECHNIQUE Isolate mRNA. Tissue sample DNA microarrays Make cDNA by reversetranscription, usingfluorescently labelednucleotides. mRNA molecules Figure 20.15 Labeled cDNA molecules(single strands) Apply the cDNA mixture to a microarray, a different genein each spot. The cDNA hybridizeswith any complementary DNA onthe microarray. DNA fragmentsrepresenting aspecific gene DNA microarray Rinse off excess cDNA; scan microarrayfor fluorescence. Each fluorescent spot(yellow) represents a gene expressedin the tissue sample. DNA microarraywith 2,400human genes
DNA innucleus mRNAs incytoplasm Reversetranscriptase Poly-A tail Figure 20.6-5 mRNA 3 5 A A A A A A 3 5 T T T T T Making complementary DNA (cDNA) from eukaryotic genes. DNAstrand Primer 3 5 A A A A A A 5 3 T T T T T 5 3 3 5 DNA polymerase 3 5 3 5 cDNA
A DNA microarray measuring gene expression based on presence of mRNA (processed as cDNA) An application of DNA annealing (double strand formation): Each dot represents a single gene. Bright colors indicate nucleic acid hybridization due to complementary sequences of the probe (on the chip) and the fluorescence labeled target cDNA in the sample. Two samples (green and red label) can be compared simultaneously revealing differences in mRNA found Red: mRNA present in sample 1 only Green: mRNA present in sample 2 only Yellow: mRNA found in both samples Voet and Voet, Biochemistry, chapter 7
Relative transcriptional activities of the genes in hepato-cellular carcinoma (HCC) tumors as determined using DNA microarrays. Clustering genes according to similarities in expression profiles readily shows differences between healthy and tumor cells. Red: gene up-regulated Green: gene down-regulated Voet and Voet, Biochemistry, chapter 34