Download
1 / 26
270 likes | 420 Vues
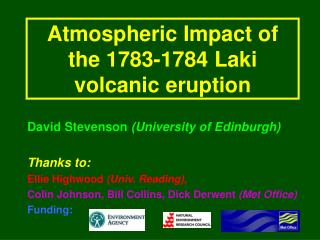
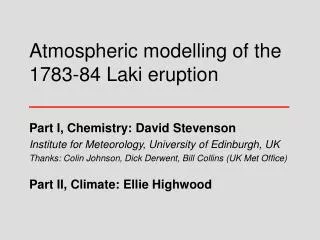
Atmospheric modelling of the 1783-84 Laki eruption. Part I, Chemistry: David Stevenson Institute for Meteorology, University of Edinburgh, UK Thanks: Colin Johnson, Dick Derwent, Bill Collins (UK Met Office) Part II, Climate: Ellie Highwood. Questions.

E N D
Atmospheric modelling of the 1783-84 Laki eruption Part I, Chemistry: David Stevenson Institute for Meteorology, University of Edinburgh, UK Thanks: Colin Johnson, Dick Derwent, Bill Collins (UK Met Office) Part II, Climate: Ellie Highwood
Questions • Using our best estimate of the Laki SO2 emissions, what is the modelled impact on the global atmospheric composition? • Does it agree with observations? • Next talk: Can it generate a climate impact?
1783-84 Laki eruption, Iceland • 8 June 1783: 27 km long fissure opens • 15 km3 of basalt erupted in 8 months • 60 Tg(S) released • 60% in first 6 weeks • Fire-fountaining up to ~800 - 1450 m • Eruption columns up to ~6 - 14 km • Tropopause at ~10 km • ‘Dry fog’ or ‘blue haze’ recorded over Europe, Asia, Atlantic, Arctic, N. America • This appears to have been a sulphuric acid aerosol layer in the troposphere and/or lower stratosphere
Atmospheric model: STOCHEM • Global 3-D chemistry-transport model • Meteorology: Hadley Centre GCM • GCM grid: 3.75° x 2.5° x 58 levels • CTM: 50,000 air parcels, 1 hour timestep • CTM output: 5° x 5° x 22 levels • Detailed tropospheric chemistry • CH4-CO-NOx-hydrocarbons • detailed oxidant chemistry • sulphur chemistry • Normally used for air quality/climate studies
Air parcel centres Eulerian grid from GCM provides meteorology Interpolate met. data for each air parcel STOCHEM framework
For each air parcel • Advection step • Interpolated winds, 4th order Runge-Kutta • Plus small random walk component (=diffusion) • Calculate emission and deposition fluxes • Prescribe gridded emissions for NOx, CO, SO2, etc. • Integrate chemistry • Photochemistry (sunlight, clouds, albedo, etc.) • Gas-phase chemistry (T, P, humidity, etc.) • Aqueous-phase chemistry (cloud water, solubility, etc.) • Mixing • With surrounding parcels • Convective mixing (using GCM convective clouds) • Boundary layer mixing
Oxidants normally determined by background photochemistry – but very high SO2 levels will affect them +OH SO2 gas SO4 aerosol emissions +H2O2(aq) (in clouds) dry(wet) deposition wet(dry) deposition Sulphur chemistry +O3(aq) Only deposition rates determine the SO4 lifetime Oxidation and deposition rates determine the SO2 lifetime
Sulphur emissions • Analysis of the S-content of undegassed magma suggests ~60 Tg(S) released by Laki (Thordarson et al., 1996) • ~1990 global annual anthropogenic input • What was the vertical profile of emissions?
Laki value 61 Peak value ~2 Total 72 1990 Anthropogenic SO2 emissions (annual total) 0.1 1 10 100 Tg(S)/yr/5x5
Model experiments • 1990 atmosphere • Background ‘pre-industrial’ atmosphere • Two laki emissions cases ‘lo’: emissions evenly distributed 0-9 km ‘hi’: 75% emissions at 8-12 km, 25% at 0-3 km • All runs had fixed (‘1996-97’) meteorology No attempt made to simulate 1783 weather • Run for one year following start of eruption • Generate aerosol distributions • No feedback between aerosols climate • Calculate radiative forcings and climate effects later
100 pptv 500 pptv 16 km 12 km 8 km 4 km 0 km 5 ppbv >10 ppbv Zonal annual mean SO2 1990 1860 100 P (hPa) 300 1000 laki lo laki hi
500 pptv 100 pptv 300 pptv 1 ppbv Zonal annual mean SO4 1990 1860 laki lo laki hi
8 6 4 2 0 Atmospheric aerosol burden Hi Lo Dashed lines Assume H2SO4.2H2O (35% more mass) Global burden H2SO4 (Tg) Background level June 1783 Feb 1784
10 10 10 100 100 100 1000 1000 1000 20 20 20 50 50 50 200 200 200 500 500 500 2000 2000 2000 5000 5000 5000 Laki SO4 evolution Upper Trop Lower Strat Surface 90°N lo Eq 90°S May 1784 June 1783 SO4 / pptv 90°N hi Eq 90°S
July SO2 (ppbv) Laki hi Surface 0.5 km 550 hPa 5 km 0.1 0.2 0.5 1 2 5 10 20 50 100 0.1 0.2 0.5 1 2 5 10 20 50 100 350 hPa 8 km 200 hPa 12 km 0.1 0.2 0.5 1 2 5 10 20 50 100 0.1 0.2 0.5 1 2 5 10 20 50 100
100 100 100 100 1000 1000 1000 1000 50 50 50 50 200 200 200 200 500 500 500 500 2000 2000 2000 2000 5000 5000 5000 5000 July SO4 (pptv) Laki hi Surface 0.5 km 550 hPa 5 km 350 hPa 8 km 200 hPa 12 km
+OH SO4 aerosol 14% +H2O2(aq) 11% +O3(aq) 3% 12% 88% 34% 38% Dry dep Wet dep Dry dep Wet dep Laki sulphur budget Lo case 17 Tg(S) or 70 Tg (H2SO4.2H2O) SO2 gas Emissions 61 Tg(S)
+OH SO4 aerosol 16% +H2O2(aq) 16% +O3(aq) 4% 10% 90% 28% 37% Dry dep Wet dep Dry dep Wet dep Laki sulphur budget Hi case 22 Tg(S) or 89 Tg (H2SO4.2H2O) SO2 gas Emissions 61 Tg(S)
Optical Depth – July 1783 Mean Lo: max 0.24 Hi: max 0.39 Assumes aerosol is H2SO4.2H2O 1 unit optical depth = 3 x 10⁻⁵ g cm-2 column aerosol Stothers (1996) observed max td~1 to 4 over Europe
Impact on oxidants (H2O2) surface 550 hPa 350 hPa 200 hPa
Conclusions • Simulated a sulphate aerosol cloud across much of the NH during the 8-month eruption, in rough agreement with ‘observations’ • but modelled optical depths are maybe 3x too small? • 60-70% of emitted SO2 is deposited before forming aerosol (previous studies assumed it all formed aerosol) • Oxidant H2O2 is strongly depleted • lengthens the SO2 lifetime • more likely to be deposited as SO2 • Environmental impacts include poor SO2 air quality and SO2 deposition, as well as acid rain • Now use the aerosol fields to calculate a climate impact…
Burden (Volcanic Tg(S) component) IPCC(2001) value IPCC(2001) value Lifetime (Volcanic Days component) Fluxes in Tg(S)/yr IPCC(2001) value Volcanic component IPCC(2001) value OH 6.3 12 0.29 (0.075) 0.46 SO2 SO4 0.81 (0.12) 0.77 1.0 1.8 1.1 (3.0) 4.9 5.3 (6.2) H2O2 32 5.5 49 46 44 O3 17 0.35 30 6.2 41 9.2 7.1 9.5 0.75 0.3 9.0 9.3 12 1.4 71 76 0.56 DMS MSA 4 1.4 2.2 Deposition Deposition 15 24 Dry Wet Dry Wet 1 1 Biomass burning Anthro- pogenic Volcanic Soil Oceanic