Criteria for SEM Location and Metering Philosophy Under ABT Regime in NTPC Generating Stations
120 likes | 260 Vues
This document outlines the criteria and methodology for the selection and metering of Special Energy Meters (SEM) at NTPC stations under the Availability Based Tariff (ABT) regime. It details the configuration of main and check meters for energy accounting in injection and drawal processes. The specifications include requirements for meter connections, data recording features, performance checks for validation, and average loss computations essential for scheduling. The criteria ensure accurate energy management and enhance operational efficiency.

Criteria for SEM Location and Metering Philosophy Under ABT Regime in NTPC Generating Stations
E N D
Presentation Transcript
Metering Philosophy under ABT regime NTPC Station Aux. Aux. Aux. M2 M1 B A C D E C1 C2 ISGS -I H S2 G S1 F F' J J' K K' L M SEB-A ISTS S T U W V N O P SEB-B R ISTS Q SEB-B SEB-A ISGS-II injection Main = (M1+M2) Check=(C1+C2) Standby = (S1+S2) X SEB-A MainMeter Y StandbyMeter CheckMeter Other than NTPC Station ISGS -II ISTS ISGS-I injection Main = (F+G+H+J+K) Check=(F'+L+M+J'+K') Standby = (A+B+C+D+E) SEB-B drawal Main = (T+U+X) Standby = (V+W+Y) SEB-A drawal Main = (G+H+N+O+Y) Standby = (L+M+Q+R+X)
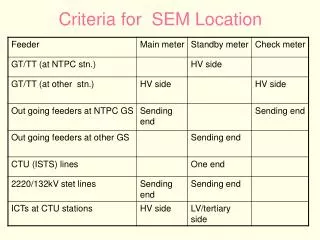
Points for Energy Accounting Injection by NTPC Generating Stations : Main &check meters on Outgoing feeders Standby meters on HV side of GT/TT Injection by other Generating Stations : Main &check meters on HV side of GT/TT Standby meters on Outgoing feeders Drawl by SEBs Main -HV side of ICTs at GS and CTU S/S, Receiving end of Lines directly connected to ISGS Respective ends of Lines connected to other SEBs Standby – LV/ Tertiary side of ICTs Other end of lines connected to other SEBs
SPECIAL ENERGY METER SPECIFICATION STATIC TYPE COMPOSITE METER HIGHEST ACCURACY IN POWER INDUSTRY 3 PHASE-4 WIRE CONNECTIONS / MEASUREMENT DIRECT MEASUREMENT AS PER CT/PT SECONDARY QUANTITIES - 110V PH TO PH/63.51 V PH-N - 1 AMP OR 5 AMP VA BURDEN NOT MORE THAN 10 ON ANY OF THE PHASES WORKS ON REAL TIME CLOCK NO CALIBRATION REQUIRED TIME ADJUSTMENT FACILITY HIGH SECURITY OF DATA STORAGE
SPECIAL ENERGY METER FEATURES DATA RECORDED : • NETT ACTIVE ENERGY IN 15 MIN. TIME BLOCKS • AVERAGE FREQUENCY IN 15 MIN. TIME BLOCK • VOLTAGE FAILURE • DAYWISE NET REACTIVE ENERGY EXCHANGES AT HIGH VOLTAGE AND LOW VOLTAGE • TIME CORRECTIONS
Raw data WEEK FROM 0000 HRS OF 06-01-01 TO 0837 HRS OF 15-01-01 NP-0185-A 91858.5 99968.5 39195.5 06-01-01 00 51 +21.57 48 +21.68 50 +21.71 49 +21.33 …. 04 19 +20.61 23 +20.80 19 +21.05 00 +21.35 … 08 00 +24.95 00 +24.95 00 +25.09 00 +24.38 … 12 71 +24.38 52 +23.98 30 +23.81 13 +24.03 … 16 00 +23.37 00 +23.52 00 +22.87 00 +21.66 … 20 00 +25.75 00 +25.32 00 +25.40 00 +25.37 … NP-0185-A 94117.2 99968.5 40313.5 07-01-01 00 59 +20.94 54 +21.01 59 +20.79 58 +21.05 … 04 33 +20.05 38 +20.17 37 +20.49 28 +20.90 … 08 00 +22.99 06 +23.10 00 +22.81 00 +22.94 … 12 85 +20.93 51 +20.65 21 +20.79 00 +19.89 … 16 07 +20.14 01 +20.53 00 +20.72 00 +20.66 … 20 05 +23.62 08 +23.23 16 +23.25 27 +23.40 … NP-0185-A 96172.2 99968.5 41236.9 08-01-01
SPECIAL ENERGY METER VARIOUS CHECKS CHECKS for DATA VALIDATION : • VOLTAGE PROBLEM • FREQUENCY • TIME CORRECTION • WATTHOUR PROBLEM • PREVIOUS WEEK DATA • ALGEBRAIC SUM
SPECIAL ENERGY METER DATA COMPUTING • RAW DATA IN WHr • MWhr = RAW DATA x CT RATIO x PT RATIO • PAIR CHECK DONE FOR MAIN/ CHECK/ STANDBY/ FICTMETERS ( ex. : for both sides of ICTs, Lines, GT side & Line side at ISGS.
Loss computations 15 min block-wise % loss = (Sum of all Injections from ISGS + net IR imports) - (Sum of Drawals by all beneficiaries from Central Grid) X 100 (Sum of all Injections from ISGS + net IR imports)
Use of Notional Loss in scheduling • % Average loss (15 min. blockwise) aggregated over the last week will be used in Scheduling Process for the next week. (for arriving at the ex-periphery Drawal Schedules of Beneficiaries) LOSS TABLE
TYPICAL %AVERAGE LOSS FIGURES FOR CENTRAL GRID IN SR %Average losses In other Regions : NR 3.5 to 4.5 ER 3.0 to 3.5 WR 5.0 to 6.0 Trend