Download
1 / 30
321 likes | 472 Vues
Using Data from Climate Science to Teach Introductory Statistics Gary Witt Temple University. The following slides show one example of combining data from climate science with basic statistical methods to tell an interesting story to students. Using Regression

E N D
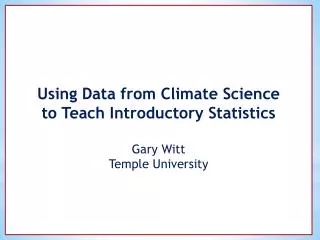
Using Data from Climate Science to Teach Introductory Statistics Gary Witt Temple University
The following slides show one example of combining data from climate science with basic statistical methods to tell an interesting story to students.
Using Regression to analyze the rate of change of Arctic Sea Ice Extent
In the late 1980’s when climate scientists began to raise concerns that increasing levels of atmospheric CO2 would cause the earth to warm, they were unsure about the rate of climate change. In particular, most estimated that the Arctic Ocean would never be ice free until the year 2100. In the last five years, many have begun to predict a more rapid melt.
Using scatterplots and regression, we can analyze the data to see the evidence for ourselves. The data we will analyze is a time series of September Arctic sea ice extent from 1979 until 2012.
What is meant by the term September Arctic sea ice? Why is it important?
As far as we know, most of the Arctic Ocean has been covered in ice year round for thousands of years (the North Pole is near the center of the Arctic Ocean). Since 1979, satellites regularly observe the ice in the Arctic Ocean. Computer programs calculate the area or extent of the ice coverage on a daily basis. These daily numbers are averaged to get the September sea ice extent. September is the month when the ice stops melting each summer and reaches its minimum extent.
The next two slides reflect images from • September 1980 when the ice extent was 7,800,000 square kilometers and • September 2012 when the ice extent was 3,600,000 square kilometers. • The pink boundary depicts the median extent from • 1980-2000.
The next two slides display the entire data set, the average Arctic sea ice extent in millions of square kilometers for each September from 1979 until 2012. Data were obtained from the National Snow and Ice Data Center in Boulder Colorado.
The regression slope of -0.092 means that the average rate of decline in September Arctic sea ice from 1979-2012 is 92,000 square kilometers per year. For perspective, the state Maine is 92,000 square kilometers so an area of sea ice the size of Maine has been melting per year.
To understand why many climate scientists now believe that the melt rate of Arctic sea ice is accelerating, plot the data that was available in 2001.
Time series from 1979-2001 When this regression was run in 2001, the slope was half as steep.
The following page is a table with the slope and intercept calculated from a linear regression run at the end of September each year since 2001.
The linear regression run each year since 2001. Notice that the slope steepens every year. The rate of decline of Arctic sea ice extent is growing.
A model that allows for a changing slope might fit the data better.
A quadratic function of the form is a simple function that allows for the slope to change at a constant rate. Its parameters, b0, b1, and b2 , can be estimated from the data using regression.
The quadratic regression visually appears to be a better fit, especially for recent data. Also, the quadratic regression increases R2 (the percentage of the variance explained by X) from 72.5% to 82.2%.
What does this quadratic regression tell us about our original question? How long will the Arctic summer sea ice last?
The ongoing debate among climate scientists: When will the ice melt? A top Oceanographer, Professor Peter Wadhams of Cambridge University, stated in an interview with the London Telegraph on Nov 8, 2011 that, “the fall-off in ice volume is so fast that it is going to bring us to zero very quickly. 2015 is a very serious prediction and I think I am pretty much persuaded that that's when it will happen.“
The ongoing debate among climate scientists: When will the ice melt? Others, such as Axel Shweigerat the University of Washington’s Polar Science Center, are more cautious. On April 11, 2012 Shweiger and his colleagues wrote in a Real Climate article that, until further study, “we need to … let previous model-based predictions of somewhere between 2040 and 2100 stand.”
Between those two extremes was a prediction made on June 27, 2011, by U.S. Navy Adm. Gary Roughead, chief of naval operations.” “Within 25 years the Arctic could become a profitable sea route from Asia to Europe.”
If we project forward our quadratic regression trend, we can see that it is consistent with the Admiral’s statement.
The quadratic regression projects that September Arctic sea ice will melt completely by the year 2027.
Climate scientists rely on much more than just a simple quadratic trend projection. In this case other lines of evidence, such as the rapidly declining thickness of the Arctic sea ice reinforce the conclusion that the melt rate of Artic sea ice will continue to increase. But for now, no one is certain how long the Arctic summer sea ice will remain.