Download
1 / 9
90 likes | 202 Vues
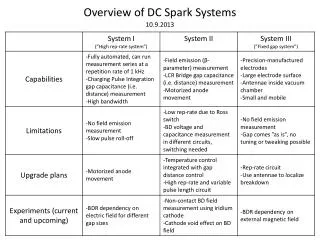
This presentation explores the High Rep Rate (HRR) system and compares BDR (Breakdown Rate) against electric field (E) scaling theories. The HRR system consists of three main sections—charging, energy storage, and power delivery. By transitioning to a solid-state switch, we increased operating frequency from 0.5 Hz to 1 kHz, resulting in significant reductions in breakdown occurrences. The analysis of breakdown statistics reveals insight into the clustering behavior of breakdown events and highlights the need for further calibration and testing of breakdown rates down to 10^-8 BDs/pulse.

E N D
Preliminary BDR vs. E scaling in DC Spark System Nick Shipman - Thursday 15th November 2012
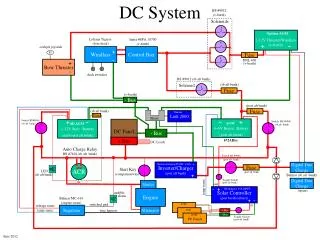
The High Rep Rate System The circuit diagram of the HRR system. It can be thought of as consisting of three parts: the charging section; the energy storage section; and the power delivery section.
Motivation behind the HRR system and BDR vs. V measurements • To investigate the low breakdown regime ~10^-7 BDs/pulse/m. • With the old mechanical relay the maximum operating frequency was only 0.5Hz. • 10^7/0.5Hz ~ 7.7months • By using a solid state switch the HRR system can operate at 1kHz • 10^7/10^3Hz ~ 3 hours We should also be able to test the BDR vs. E scaling theory proposed by FluyraDjurabekova. [PRSTAB 12 (2009) 102001] Grudiev et al.
The global surface field at 3.4kV is 170MV/m with a gap size of 20um but the gap must be re-measured.
Distribution of the number of RF pulses between BDs (clusters problem) • Inside clusters the BD probability becomes very high. • Discarding BDs within clusters allows to focus on the stationary BD statistics, well fitted by a Poisson law BD count evolution shows several period of intense BDs activity: clusters CTF3 days - 11 October 2012
Distribution Analysis The distribution between BDs obeys the Poisson law but only when clusters have been removed Steep vertical parts are indicative of clusters.
Another Possible Problem Breakdowns after switch has opened Very short breakdown ~as expected 2us long breakdown… not expected After the switch is opened the applied voltage doesn’t drop immediately to zero but slowly decays through an 80k bleed resistor. Thus breakdowns can still occur after the switch opens as the voltage is still high. What is surprising is the length some of these breakdowns can last for given they should not have access to the energy stored on the PFL.
Outlook • Re-calibrate sample holder so the gap distance is known • Figure out open switch breakdown issue • Raise the repetition rate from 500Hz 1kHz • Get to the stage where the equipment can be run fully automatically. • Reattach current integration interlock • Re-test lab view program • Automatically download traces from scope (low priority) • Probe breakdown rates down to 10^-8 BDs/pulse (~3days with 10BDs at 1kHz) • First sparks in fixed gap system