Download
1 / 42
420 likes | 600 Vues
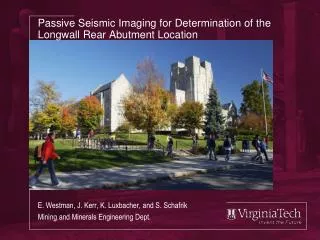
Passive Seismic Imaging for Determination of the Longwall Rear Abutment Location . E. Westman, J. Kerr, K. Luxbacher , and S. Schafrik Mining and Minerals Engineering Dept. What is the rear abutment?. What is the rear abutment?. What is the rear abutment?. Forward Abutment.

E N D
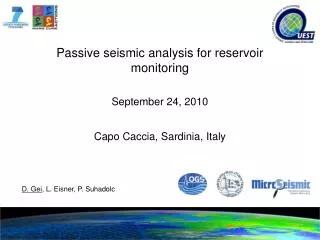
Passive Seismic Imaging for Determination of the Longwall Rear Abutment Location E. Westman, J. Kerr, K. Luxbacher, and S. Schafrik Mining and Minerals Engineering Dept.
What is the rear abutment? Forward Abutment
What is the rear abutment? Forward Abutment Side Abutment
What is the rear abutment? Forward Abutment Rear Abutment? Side Abutment
What is the rear abutment? Where ? How Big ? Forward Abutment Rear Abutment? Side Abutment
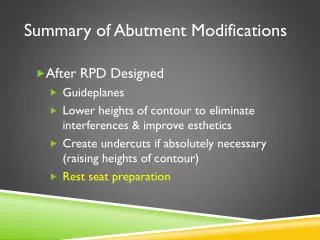
Why is it important? • Safety and Efficiency • Cave development • Initial • Progression • Ventilation • Methane accumulation in compacted gob • Calibration of numerical models
What is Tomography? • Analysis of energy transmitted from one boundary to another allows imaging of body (Radon, 1917)
Background • ‘Stress’ vs. seismic velocity
Background • ‘Stress’ vs. seismic velocity
Background • ‘Stress’ vs. seismic velocity
For best results: • 360 degrees of coverage • ‘many’ source and receiver locations
Study Site • Western US Longwall • 1200 ft deep seam, 1500 ft by 1500 ft area • Data collected by NIOSH • 16 surface geophones were used • 10 stations minimum to locate an event • A total of 12,683 seismic events were identified over 19 days
July 26 Aug 1 Aug 6
July 26 Aug 1 Aug 6
July 26 Aug 1 Aug 6
Observations - Location • High velocity region caused by the forward abutment stress associated with movement of the longwall face is clearly shown moving with the face location • Higher velocities are seen near the tailgate side of the face and along the tailgate entry • The lowest velocities seen in the images are located in the gob inby the longwall face. • These low-velocity regions also clearly move with the face position.
Observations - Location • The measured velocities parallel to the face but inby the face agree with expected stress redistribution, providing a measure of confidence in the results obtained by the current study. • For each of the three days, the peak forward abutment stress is located approximately 30 m (100 ft) outby the face, the lowest velocity is located from 65 to 90 m (200 to 300 ft) inby the face, and the presumed rear abutment occurs 190 to 240 m (600 to 800 ft) inby the face.
Observations – Magnitude • At this mine, possible rear abutment stress observed that is slightly higher than in situ stress but only about one-quarter of the increase seen for the forward abutment
Comparison • Chen et al. (2002) borehole pressure cell measurements in the active panel show an increased loading that initiates 85 m outby the face for one panel and 120 m outby the face for the subsequent panel, which is in close agreement with the results obtained by the current study (100 m). • The field measurements show the peak forward abutment stresses were measured in close proximity to the face, at a distance of less than 10 m (33 ft). This is less than what is observed by the passive seismic tomography, which is probably a result of the smoothing inherent in the tomography calculations.
Comparison • The observed location of the rear abutment at a distance approximately equal to the face width supports the adage that the full cave occurs in a longwall panel when the gob has “squared up,” (i.e., when the length of the gob is equal to its width). • Additionally, the current results agree somewhat with measurements made by Maleki (1984) using Gloetzl cells located in the gob. At a Western US semi-caving panel coal mine having a 150 m (500 ft) wide face, Maleki measured a rear abutment at a distance of 180 m (590ft) behind the face.
Conclusions • Analysis of the cross-sections parallel to the face and approximately 100 m (330 ft) inby the face clearly shows loading on the headgate and tailgate pillars as expected, providing confidence in the tomography results. • The forward abutment peaks approximately 30 m (100 ft) outby the face and initiates approximately 100 m (330 ft) outby the face, which agrees relatively well with measurements by others.
Conclusions • The cross sections parallel to the gateroads indicate that the gob extends from 65 to 90 m (200 to 300 ft) inby the face, and that the presumed rear abutment occurs 190 to 240 m (600 to 800 ft) behind the face. • Additionally, future research could include comparison to subsidence data to determine whether the location of the rear abutment can be correlated to the location of completed subsidence.
Acknowledgements • Pete Swanson, NIOSH • NIOSH Ground Control Capacity Building Program • Haijiang Zhang, MIT
Time Distance
Goal • Doppler radar for underground