Download
1 / 56
560 likes | 710 Vues
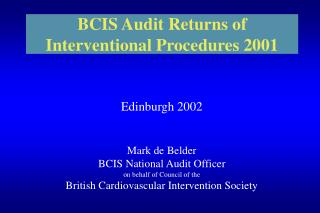
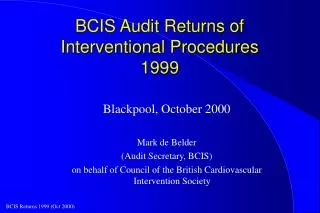
BCIS Audit Returns of Interventional Procedures 2000. Southampton, October 2001. Mark de Belder BCIS UK National Audit Officer on behalf of Council of the British Cardiovascular Intervention Society. UK Intervention Centres. UK Interventional & Diagnostic Centres 2000.

E N D
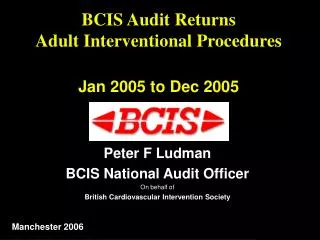
BCIS Audit Returns of Interventional Procedures 2000 Southampton, October 2001 Mark de Belder BCIS UK National Audit Officer on behalf of Council of the British Cardiovascular Intervention Society
UK Interventional & Diagnostic Centres 2000 Making assumptions about no. of caths done in centres not reporting, estimated caths in UK approx 145,000 = 4.3 caths/PCI 3.5 caths for every 1 PCI in Intervention centres (1.2-82) (3.51 NHS, 3.73 Private)
Centres providing NO DATA • None!
Centres providing NO or MINIMAL data on Centre Description Form (A) • Harefield • Edinburgh Royal Infirmary • Sheffield • (Ayrshire & Arran) • Cromwell • Bristol BUPA
No data Harefield BUPA Bristol Minimal Data Birmingham QEH Yorkshire Ht Centre Sheffield Centres providing NO or MINIMAL DATAon Minimum Data Form (B)
Belfast City City, Birmingham Harefield Yorkshire Heart Centre UH Wales, Cardiff London Chest Manchester RI John Radcliffe, Oxford Royal Brompton Northern, Sheffield St Bartholomew’s St Mary’s Derriford, Plymouth Eastbourne Wellington Ross Hall London Independent St Anthony’s The Priory, Birmingham Harley St Clinic BUPA Bristol BUPA Lea Cambridge Centres with MINIMAL or NO DATAon Outcome Form (C)
Cath Lab Data Only Blackpool Edinburgh Western Wythenshawe Morriston, Swansea BMI Alexander, Manchester BUPA Leicester HCI Glasgow Unspecified Data Belfast Royal Victoria Birmingham QE Bristol Royal Infirmary Hammersmith Hull Royal Infirmary Papworth Edinburgh Royal Infirmary Glasgow Western Glasgow Royal Infirmary Liverpool CTC Middlesex/UCH Freeman, Newcastle Glenfield, Leicester Hairmyres Centres with no HOSPITAL Outcome Data • Unspecified Data • BUPA Leeds • London Bridge • Cromwell • Yorkshire Heart Clinic • Park, Nottingham
Volume of procedures in NHS CentresTotal number of procedures per annum
PCI vs Isolated CABG Rates (UK)Data from BCIS and SCTS Registry
No. of Consultant Interventionists in NHS Centres, 2000 data from 48 centres Average 5.5 / Centre
No of PCIs per Consultant in NHS Centres, 2000data from 48 centres Average 125 / Consultant
Stenting in different centres 1998-20002000 data from 61 centres
Stenting and the need for emergency CABG (2000 data from 40 centres)
Stenting and procedures for restenosis (2000 data from 40 centres)
ReoPro in different centres 1999 - 20002000 data from 61 centres ReoPro used in 22% of cases in 2000 50 cases using eptifibatide or tirofiban reported
Other procedures 2000 - 1 +, =, - : increase, no change or decrease compared to 1999 * mainly Xsizer NB Only 2 reported to voluntary registry
Other procedures 2000 - 2 +, =, - : increase, no change, or decrease compared to 1999 * Mainly Angioseal
Other Procedures 2000 - 3 +, =, - : increase, no change, or decrease compared to 1999
Other Procedures 2000 - 4 +, =, - : increase, no change or decrease compared to 1999 * Some centres give combined data for ASD/PFO closure
Other Procedures 2000 - 5 +, =, - : increase, no change, or decrease compared to 1999
Other procedures 2000 - 6 +, =, - : increase, no change, or decrease compared to 1999
Aberdeen Birmingham Heartlands Guy’s & St Thomas’s King’s College Hospital Walsgrave, Coventry Royal Free Hospital Stoke City General Southampton St George’s James Cook UH, Middlesbrough Nottingham City Hospital Royal Devon & Exeter KE VIIth, Midhurst Sandwell Hospital Royal Sussex County, Brighton Ayrshire & Arran RCH Truro Heart Hospital Centres providing complete or near complete data on Hospital Outcome 2000 (18)
Hospital OutcomeFreedom from MACE rates (with 95% CI)Data from 18 centres
Hospital OutcomeFailed Procedures (with 95% CI)Data from 18 centres
Hospital Outcome 2000Elective patients * does not account for clinical syndrome
Hospital Outcome 2000Patients with previous CABG and those treated for restenosis * does not account for clinical syndrome
Hospital OutcomeElective Single Vessel PCI (no CTO)Success (Freedom from MACE) rates (with 95% CI)Data from 15 centres
Hospital OutcomeElective Single Vessel PCI (no CTO)Mortality rates (with 95% CI)Data from 15 centres
Hospital OutcomeCardiogenic Shock PCI (Primary or Rescue)Mortality rates (with 95% CI)Data from 15 centres 1 of 1
Comparison of data reported from a single centre with other contributing centres