Enhanced Process Mining Techniques for Improved Performance Monitoring
Explore the utilization of multi-phase process mining methods for monitoring and optimizing performance. This detailed overview covers control flow rediscovery, social network analysis, and organizational models. Learn how to aggregate process instances and generate a comprehensive specification for effective monitoring systems.


Enhanced Process Mining Techniques for Improved Performance Monitoring
E N D
Presentation Transcript
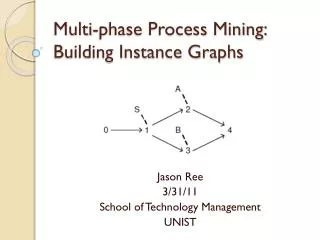
Multi-phase process mining EPC representations of process instances, and the aggregation of those into one overall specification.
Outline • Introduction to Process Mining • Introduction to process performance monitoring • Using process mining to deploy a monitoring system • Extending • Conclusion
Overview Process Mining 2) Control flow rediscovery 3) organizational model 4) social network 1) basic performance metrics 5) performance characteristics 6) auditing/security If …then … www.processmining.org
Log Files • Information systems typically log all kinds of events. We use a XML format for storing event logs. The basic assumption is that the log contains information about specific tasks executed for specific process instances (cases, event-lists, audit trails). We do not assume any knowledge of the underlying process.
Log based ordering relations • If there is a process instance (trace, eventlist) in which two functions A and B follow each other directly, we say: A > B • Causal relations: • A B if and only if A > B and ¬B > A • Parallel relations • A || B if and only if A > B and B > A • Note, if two tasks A and B are in a loop of length two (I.e. there is a trace such that A B A is in that trace) then A B and B A and not A || B
A G B S E T C F D Process Mining, the α-algorithm • Using the and || relation, we construct places for the resulting Petrinet. {E} {G, F } {F} {C} {F} {D } {B, D} {T }
The problems of the α-algorithm • Known issues of the α-algorithm algorithm: • - It requires its input to come from a certain class of models. • Tasks that can be skipped in the original process: ( AC , ABC ) • Tasks that appear twice in the same process, under the same name. • Tasks that do not appear in the log, but belong in the process. (Invisible tasks) • Errors in the input data (I.e. one trace containing AB versus one million traces containing BA.)
or C A D E B Calculating causal relations • Using the causal relation, we construct a general base graph for all cases: And then to: A B A C A D C D B D D E Assume we have the following cases: A,B,C,D,E A,C,B,D,E A,D,E This leads to these relations: A>B B>C C>D D>E A>C C>B B>D A>D
Creating instance graphs • For each instance, we walk through the base graph and make instance graphs for each case. C Process instance: A,B,C,D,E and A,C,B,D,E A D E B C A Process instance: A,D,E D E B
Process instance: A,B,C,D,E and A,C,B,D,E Converting to EPCs • Each instance-graph is then converted into a human readable format, such as an EPC Process instance: A,D,E
C A D E B A D E Aggregating instance graphs • Assume we have a set of instance graphs: • 2x • 1x • Can we aggregate them into one model? Our log file: A,B,C,D,E A,C,B,D,E A,D,E
C1 1 1 D1 E1 A1 1 1 1 B1 A1 D1 E1 1 1 Aggregating instance graphs • First, we project the instances onto themselves, to distinguish between • “task executions” and “tasks that were executed” Our log file: A,B,C,D,E A,C,B,D,E A,D,E
Aggregating instance graphs • Combine the graphs based on node labels • Decide on split/join type C2 2 2 3 3 A3 D3 E3 Our log file: A,B,C,D,E A,C,B,D,E A,D,E 2 2 B2 C A D E B
a b Ax c Aggregating instance graphs • What type of split / join to choose? • x = a = b = c implies AND • x = a + b + c implies XOR • else OR
C A D E B Conversion to EPC • Conversion to an EPC is done in the same way as for instance graphs • Becomes: Our log file: A,B,C,D,E A,C,B,D,E A,D,E
D H D A B G B E C I C (a) D D A B E A B F C C (c) (b) Example • Consider the following instance graphs:
D 1 E t 1 2 f 2 1 1 1 t A B 1 1 s 2 2 1 1 1 G C 1 2 1 (a) H 1 1 1 1 1 I 1 D 1 1 1 t t A B E 1 1 1 f 1 s 1 1 1 1 1 1 C 1 D (b) 1 1 1 t 1 t A B F 1 1 f 1 s 1 1 1 1 1 1 C 1 (c) Example • That will lead to the following instance graph projections:
Example • Which results in this aggregation graph: 1 F 1 1 1 D 2 E t 2 4 f 4 2 2 3 t A B 3 3 s 4 4 3 3 1 C 4 1 G 1 H 1 1 1 I 1 1 1
1 1 G 1 1 1 Example
Comparison to α-algorithm • The α-algorithm requires its input to come from a certain class of models. • The multi-phase system does not have this requirement. The result is always an executable specification. • The α-algorithm cannot deal with tasks that can be skipped ( AC , ABC ). • The multi-phase system deals with this easily, using connectors (invisible steps) • The following issues still stand: • Tasks that appear twice in the same process, under the same name. • Tasks that do not appear in the log, but belong in the process. (Invisible tasks) • Errors in the input data (I.e. one trace containing AB versus one million traces containing BA.)
Conclusions • The multi-phase system is an improvement to the α-algorithm • The multi-phase system improves the practical applicability of the • mining research, since it can be used as an interface between • Aris PPM and the ProM-framework • Further research is needed to deal with duplicate tasks, • invisible tasks and noisy log files