Download
1 / 1
10 likes | 126 Vues
Flood Control. Multiple Use Zone. Reductions to Carryover Storage and Dead Pool Zones. Runoff. r 2 SWE. Carryover Storage. r 2 SOI/AO. Dead Pool. SOI/AO. SWE. Flood Control. Missouri River Basin. Multiple Use Zone. Lead-4. Lead-3. Lead -2. Lead 1. Lead-0.

E N D
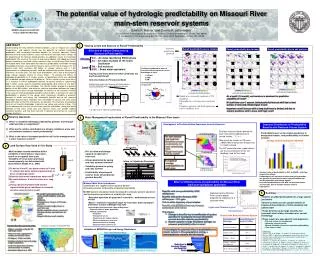
Flood Control Multiple Use Zone Reductions to Carryover Storage and Dead Pool Zones Runoff r2SWE Carryover Storage r2SOI/AO Dead Pool SOI/AO SWE Flood Control Missouri River Basin Multiple Use Zone Lead-4 Lead-3 Lead -2 Lead 1 Lead-0 Reduced-volume Missouri River system applies proportional reductions to 3 upstream dams Benefits above zero predictability, $ million Carryover Storage Forecast Season DJF M A N F M A J J S O D J 4 x 5 grid of average predictabilities for each area 31% 47% 4% 12% 6% Dead Pool Dec 1 Mar 1 Jun 1 Sep 1 Dec 1 Initialization Dates for DJF Forecast Ft. Peck Garrison Oahe Big Bend Ft. Randall Gavins Pt. E P W Q 5 Summary Contributing Areas • For each season and lead time: • Establish average predictability for each contributing area • Weight each grid cell by runoff Predictability Hypothetical Reduced system Existing System The potential value of hydrologic predictability on Missouri River main-stem reservoir systems Edwin P. Maurer1 and Dennis P. Lettenmaier2 1. Department of Atmospheric Sciences, Box 351640, University of Washington, Seattle, WA 98195 2. Department of Civil Engineering, box 352700, University of Washington, Seattle, WA 98195 GEWEX Americas Prediction Project 2003 PIs Meeting 3 ABSTRACT Understanding the links between remote conditions, such as tropical sea surface temperatures, and regional climate has the potential to improve streamflow predictions, with associated economic benefits for reservoir operation. Better definition of land surface moisture states (soil moisture and snow water storage) at the beginning of the forecast period provides an additional source of streamflow predictability. We examine the value of long-lead predictive skill added by climate forecast information and land surface moisture states in the Missouri River basin. Forecasted flows were generated that represent predictability achievable through knowledge of climate, snow and soil moisture states at the time of forecast. For the current main stem reservoirs (90 billion m3 storage volume) only a 1.8% improvement in hydropower benefits could be achieved with perfect forecasts for lead times up to one year. This low value of prediction skill is due to the system’s large storage capacity relative to annual inflow. To evaluate the effects of hydrologic predictability on a smaller system, a hypothetical system was specified with a reduced storage volume of 36 billion m3. For this smaller system there was a 7.1% increase in annual hydropower benefits for perfect forecasts, representing $25.7 million. Using realistic streamflow predictability, $6.8 million of the $25.7 million are estimated to be realizable. The climate indices provide the greatest portion of the $6.8 million, and initial soil moisture information provides the largest incremental value above climate knowledge. An analysis of the seasonal variation in the value of runoff predictability provides further insights. In general, the value of predictability is greatest in the spring, when interannual variability is greatest; whereas in winter and spring, the incremental benefits due to soil moisture knowledge (beyond those realizable from knowledge of climate and snow water equivalent state at the time of forecast), are greatest. This illustrates the potential value of soil moisture knowledge in determining spring and summer inflows. The results demonstrate that the use of climate forecast information, along with better definition of the basin (snow and soil) moisture states, can provide modest economic benefits, and that these benefits in general will increase as reservoir storage decreases. Varying Levels and Sources of Runoff Predictability Season of runoff being predicted Runoff predictability due to climate Runoff predictability due to snow Runoff predictability due to soil moisture Selection of Indices Characterizing Sources of Predictability • SOI – An index identifying ENSO phase • AO – An index of phase of the Arctic Oscillation • SM – Soil moisture • SWE – Snow water equivalent Increasing Lead Time Climate Land • Variables introduced in order of how well indices represent current knowledge of state: • SOI/AO • SWE • SM • Incremental predictability assessed for each tier Varying Lead Times between Initial Conditions (IC) and Forecast Runoff Only Use Indices in Persistence Mode Multiple linear regression between selected predictors (SOI/AO/SM/SWE) and runoff at different lead times Shaded areas are locally significant at 95% confidence Color indicates r2 of regression at each grid cell X indicates no basin-wide field significance at 95% confidence level • At a lead-0 (1.5 month), soil moisture is dominant for predictive capability of runoff • At lead times over 1 season, limited potential forecast skill due to land surface in west and climate signal in east • Important runoff forecast skill at long lead times is limited, and due to modest predictive skill in areas with high runoff r2 of regression is indicator of predictability 1 4 Science Questions Water Management Implications of Runoff Predictability in the Missouri River basin • Where is seasonal hydrologic predictability greatest, and through what lead time is it significant? • What are the relative contributions of climate conditions, snow and soil moisture content to runoff predictability? • What is the value of increased predictive skill to the management of a water resources system? Development of Predicted Inflow Sequences for each Reservoir Seasonal Distribution of Predictability Benefits with Reduced-Volume System Synthetic forecast inflows derived for each reservoir by adding noise to served inflows: Predictability level set for chosen predictors in designated season; zero predictability in all other seasons. Step month by month, for 99 years (1898-1996) making new forecasts for 12 months ahead The 90th percentile flows (upper decile) are the assumed level of risk (for flooding) used for this study Average Annual Hydropower Benefits 2 Land Surface Data Used in this Study 90% of inflow • 90% of inflow and storage capacity at upstream 3 reservoirs • Inflows dominated by spring and early summer snowmelt • Variability greatest in spring and early summer • Predictability of spring and summer flows should provide greatest benefits • Multi-decadal records needed to define variability of soil moisture, snow water, runoff on a seasonal time scale. • Variability of these states and fluxes cannot generally be determined with observations (Roads et al., 2003) Inflow to 3 Upstream Reservoirs • To derive W and E, use observations of P (and T), which have better spatial representation to drive a hydrologic model • Illustrate that model reproduces observed Q • By water balance, E must be close over long term • Using a physically-based land surface representation gives confidence in seasonal variation represented in model • Greatest value of predictability in DJF and MAM – affecting large future inflows. • Knowledge of soil moisture in winter and spring provides the greatest incremental increase in benefits above that already attainable with climate signals. • Increased predictability in JJA with soil moisture lowers annual value, due to variable monthly value of hydropower. Effect of differing levels of predictability on Missouri River mainstem hydropower generation • Missouri Main Stem hydropower: • Constitutes the largest current system benefit • Provides a metric for benefits of runoff predictability • MOSIM system simulation model developed to simulate system operation and hydropower generation at monthly time step • Simulates operation of upstream 3 reservoirs – downstream are run-of-river • March 1 reservoir evacuation target for each dam: drain during fall and winter to base of Multiple Use zone • Uses model constraints from Corps of Engineers • Physical limits of dams, penstocks • Release constraints: • Navigation • Endangered species • Spawning, water supply, irrigation • Minimum hydropower generation • Maximum release for flooding • Maximum winter release for ice Benefits with zero predictability: $530 million/year Benefits with perfect forecast: $540 million/year – 1.8% gain This is within trajectory of past studies Benefits with MOSIM without any forecast component: $510 million • VIC model used to generate time series of soil moisture, snow, and runoff • Features: • Developed over 10 years at Princeton and UW • Energy and water budget closes at each time step • Multiple vegetation classes in each cell • Sub-grid elevation band definition (for snow) • Subgrid infiltration/runoff variability • Benefits of added predictability for a large system are limited • Smaller systems can see greater benefits of improved determination of initial condition and climate state • These benefits can be large amounts, but represent small relative increases over current technology • These results are case-specific and depend on: • Physical system for management • Operating rules of system • Natural variability (current vs. potential predictability) • Time value of water • This shows: • Change to benefits due to modification of system operation to incorporate forecast information exceeds benefits added by predictability • System capacity is large (multi-year storage), so seasonal predictability effect is small Results with Reduced Volume System • Resulting Data Set used in this study: • 50-year+ simulation using the VIC hydrologic model • 3-hour time step, aggregated to monthly and seasonal values • 1/8 degree (~12 km) resolution • Variables include all water and energy budget components • Long term spatial data set allows characterization of variability • Described in Maurer et al., 2002 Domain coincides with LDAS-NA Validation of MOSIM Storage and Energy Simulations To investigate the potential effect of predictability on a smaller system in this geographical setting, a reduced-volume scenario was developed: • References: • Maurer, E.P., A.W. Wood, J.C. Adam, D.P. Lettenmaier, and B. Nijssen, 2002, A Long-Term Hydrologically-Based Data Set of Land Surface Fluxes and States for the Conterminous United States, J. Climate 15(22), 3237-3251. • Roads, J., E. Bainto, M. Kanamitsu, T. Reichler, R. Lawford, D. Lettenmaier, E. Maurer, D. Miller, K. Gallo, A. Robock, G. Srinivasan, K. Vinnikov, D. Robinson, V. Lakshmi, H. Berbery, R. Pinker, Q. Li, J. Smith, T. von der Haar, W. Higgins, E. Yarosh, J. Janowiak, K. Mitchell, B. Fekete, C. Vorosmarty, T. Meyers, D. Salstein S. Williams, 2003, GCIP Water and Energy Budget Synthesis, J. Geophys. Res. (in review).