Download
1 / 29
290 likes | 414 Vues
USGS Analysis of Storm-Tide Impacts from Hurricane Sandy, and Plans during Future Coastal Storms. Chris Schubert, USGS 2014 Long Island-NYC Emergency Management Conference. USGS workshop outline. What’s new in the past year?

E N D
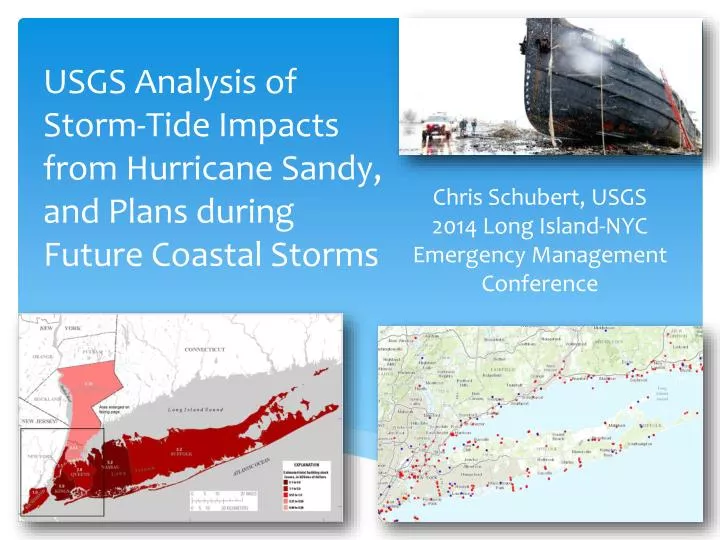
USGS Analysis of Storm-Tide Impacts from Hurricane Sandy, and Plans during Future Coastal Storms Chris Schubert, USGS 2014 Long Island-NYC Emergency Management Conference
USGS workshop outline • What’s new in the past year? • Comparisons of Sandy’s peaks to historical storms and annual exceedance probabilities (recurrence intervals) • Assessments of storm-surge magnitude and timing • Comparisons of inundation maps derived from differing amounts of available data • Where is USGS headed on coastal storms? • Storm, Wave, and Tide Hydrodynamics (SWaTH) Network
Storm surge versus storm tide http://www.nhc.noaa.gov/surge/
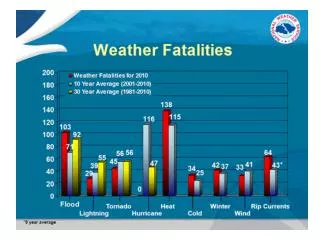
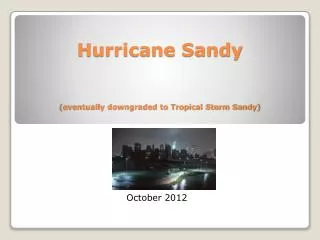
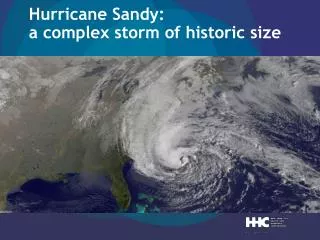
Sandy—by the numbers • Largest-sized storm to hit U.S. • Second costliest storm in U.S. history • 253 lives lost overall; 77 in NY, NJ & CT • About 2/3 of 77 deaths due to surge
Sensor strapped to bridge piling at Great South Bay, Captree Island, NY. RDG installed on bridge over State Boat Channel, Captree Island, NY.
Rockaway Inlet at Floyd Bennett Field, NY. Hudson Bay at Freeport, NY
Wash line on building Belle Harbor, Queens County, NY. Seed line on side of fence, Tottenville, Richmond County, NY. Surveying of debris line, Throgs Neck, Bronx County, NY.
Permanent and temporary monitoring sites and high-water-mark sites that documented the storm tide of Hurricane Sandy
Permanent and temporary monitoring sites and high-water-mark sites that documented the storm tide of Hurricane Sandy
The need for an interpretive report to assist FEMA and other stakeholders in future flood-damage analysis and flood mitigation prompted the current analysis of Hurricane Sandy under this mission assignment. • The analysis of storm-tide impacts focused on • comparisons of peak storm-tide elevations to those from historical storms and to annual exceedance probabilities; • assessments of storm-surge magnitude and timing; and • comparisons of inundation maps derived from differing amounts of available sensor and HWM data.
Differences in feet between peak storm-tide elevations produced by Hurricane Sandy and the storm of December 11-13, 1992
Differences in feet between peak storm-tide elevations produced by Hurricane Sandy and Tropical Storm Irene
Select annual exceedance probabilities for peak storm-tide elevations produced by Hurricane Sandy
Select annual exceedance probabilities for peak storm-tide elevations produced by Hurricane Sandy
Storm-surge magnitude associated with the peak storm tide produced by Hurricane Sandy
Magnitude of the peak storm surge produced by Hurricane Sandy
Extents of storm-tide inundation from Hurricane Sandy derived from differing amounts of USGS storm-tide data—10/31/12 NHC SLOSH model hindcast product
HAZUS estimates of total building stock losses due to storm-tide inundation from Hurricane Sandy for 10/31/12 NHC SLOSH model hindcastproduct
Surge, Wave, and Tide Hydrodynamics (SWaTH) Network • The SWaTH network expands upon the USGSstorm-tide program started after Hurricane Katrina. • Network developed for Northeast Coast from Virginia to Maine. • Expanded to include deployment for major Nor’easters, in addition to tropical systems. • Provides a foundation for integrated science and decision support. • Will be used as a template for the remainder of the Nation’s coastline.
Surge, Wave, and Tide Hydrodynamics (SWaTH) Network • Network developed with input from Federal, State and local partners, emergency managers, and coastal researchers and modelers. • Includes both long-term and temporary stations operated by the USGS and other partners. • Provide key data for enhanced mapping of inundation, contamination, and erosion vulnerability. • Provide baseline data for assessing coastal ecosystem change and adaptive management planning.
Surge, Wave, and Tide Hydrodynamics (SWaTH) Network • Entire proposed network consists of about 1,000 sites: • 76 non-USGS stations, • 162 coastal stations/tidal streams, • 60 rapid-deployment gages, • 384 temporary storm-tide sensors, • 217 temporary wave sensors, • 102 temporary barometric-pressure sensors. • Not all stations will be fitted with sensors for any one storm. • Data distributed through an online mapper in near-real time or as data is collected.
Surge, Wave, and Tide Hydrodynamics (SWaTH) Network • Long Term (blue points): station such as a continuous-record coastal-monitoring station or tidal streamgage. • Temporary (red points): storm-deployed gage such as an RDG, or storm-tide, wave-height, or barometric-pressure sensor.
Surge, Wave, and Tide Hydrodynamics (SWaTH) Network • Distributed (blue points):stations spaced geographically to facilitate monitoring on a regional scale or for high-priority sites. • Transect (orange points):stations included as part of a wetlands or urban transect (e.g. from open coast to back bays to inland).
Deployment Schedule • The proposed timeline for deploying the temporary sensor brackets and RPs is as follows: • Complete all existing locations (those deployed for Sandy and Irene) by June 15, 2014; • Complete 80% of the entire network by August 1, 2014; • Complete 100% of the network by September 30, 2014.
For more information, contact: Chris Schubertschubert@usgs.gov Ron Busciolanorjbuscio@usgs.gov U.S. Geological SurveyN.Y. Water Science Center(631) 736-0783, -4283 faxhttp://ny.water.usgs.gov http://ny.water.usgs.gov