Download
1 / 4
40 likes | 217 Vues
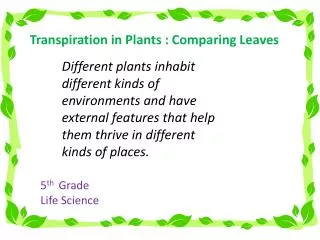
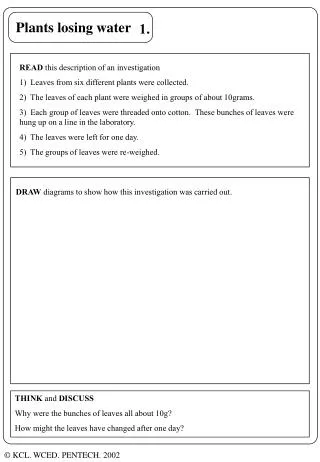
1. READ this description of an investigation 1) Leaves from six different plants were collected. 2) The leaves of each plant were weighed in groups of about 10grams. 3) Each group of leaves were threaded onto cotton. These bunches of leaves were hung up on a line in the laboratory.

E N D
1. READ this description of an investigation 1) Leaves from six different plants were collected. 2) The leaves of each plant were weighed in groups of about 10grams. 3) Each group of leaves were threaded onto cotton. These bunches of leaves were hung up on a line in the laboratory. 4) The leaves were left for one day. 5) The groups of leaves were re-weighed. DRAW diagrams to show how this investigation was carried out. THINK and DISCUSS Why were the bunches of leaves all about 10g? How might the leaves have changed after one day?
2. CALCULATE the loss of weight for each group of leaves and COMPLETE the table. weight (g) on 1st day weight (g) on 2nd day weight (g) loss number of stomata Type of plant Spider plant 9.2 10.1 10.0 8.8 Laurel 10.0 7.8 Privet 9.4 10.0 Jewel Cherry Laurel 10.2 8.7 Euronymus 10.0 8.7 DISCUSS and WRITE why the leaves have lost weight. PREDICT the relative number of stomata on each type of leaf. CALCULATE the percentage weight loss for each plant. Why is this data better?
3. LOOK at the lower epidermis of each leaf type when viewed under the microscope. COUNT the stomata for each leaf and COMPLETE the table on sheet 2. DISCUSS the differences.
4. PLOT a line graph to compare the number of stomata and weight loss for each plant. USE the data on sheet 2. DESCRIBE the pattern shown in the graph. How might the Laurel be different from the other plants? DISCUSS and EXPLAIN where you would expect a Jewel plant to grow.