Significant Figures
This comprehensive guide covers the concepts of significant figures and scientific notation, essential for accurate scientific measurements. Explore the rules for determining significant figures and how to correctly utilize them in calculations. Learn the powers of ten, converting measurements into scientific notation, and the importance of precision and accuracy in reporting data. Practice problems help reinforce the application of these principles in real-world scenarios, ensuring a strong foundation in scientific measurement techniques.

Significant Figures
E N D
Presentation Transcript
Factor Name Symbol Factor Name Symbol 10-1 decimeter dm 101 decameter dam 10-2centimeter cm 102 hectometer hm 10-3millimeter mm 103kilometer km 10-6micrometermm 106 megameter Mm 10-9nanometer nm 109 gigameter Gm 10-12 picometer pm 1012 terameter Tm 10-15 femtometer fm 1015 petameter Pm 10-18 attometer am 1018 exameter Em 10-21 zeptometer zm 1021 zettameter Zm 10-24 yoctometer ym 1024 yottameter Ym
Scientific Notation: Powers of Ten Rules for writing numbers in scientific notation: Write all significant figures but only the significant figures. Place the decimal point after the first digit, making the number have a value between 1 and 10. Use the correct power of ten to place the decimal point properly, as indicated below. a) Positive exponents push the decimal point to the right. The number becomes larger. It is multiplied by the power of 10. b) Negative exponents push the decimal point to the left. The number becomes smaller. It is divided by the power of 10. c) 10o = 1 Examples: 3400 = 3.40 x 10³ 0.0120 = 1.20 x 10⁻² Nice visual display of Powers of Ten (a view from outer space to the inside of an atom) viewed by powers of 10!
Accuracy vs. Precision Good accuracy Good precision Poor accuracy Good precision Poor accuracy Poor precision Random errors: reduce precision Systematic errors: reduce accuracy (instrument) (person)
Accuracy Precision • correctness • check by using a different method • poor accuracy results from procedural or equipment flaws. • reproducibility • check by repeating measurements • poor precision results from poor technique
Reporting Measurements • Using significant figures • Report what is known with certainty • Add ONE digit of uncertainty (estimation) Davis, Metcalfe, Williams, Castka, Modern Chemistry, 1999, page 46
1 2 3 4 5 0 cm 1 2 3 4 5 0 cm 1 2 3 4 5 0 cm Practice Measuring 4.5 cm 4.54 cm 3.0 cm Timberlake, Chemistry 7th Edition, page 7
4 4 6 6 3 3 5 5 Implied range of uncertainty in a measurement reported as 5 cm. Implied range of uncertainty in a measurement reported as 5.0 cm. 4 6 3 5 Implied range of uncertainty in a measurement reported as 5.00 cm. Implied Range of Uncertainty Dorin, Demmin, Gabel, Chemistry The Study of Matter 3rd Edition, page 32
? 20 15 mL ? 1.50 x 101 mL 15.0 mL 10
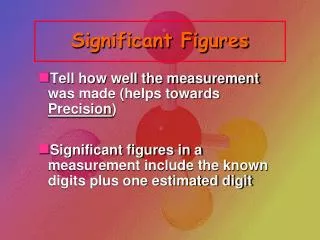
Significant Figures • Indicate precision of a measurement. • Recording Sig Figs • Sig figs in a measurement include the known digits plus a final estimated digit 2.35 cm Courtesy Christy Johannesson www.nisd.net/communicationsarts/pages/chem
Significant Figures • Counting Sig Figs • Count all numbers EXCEPT: • Leading zeros -- 0.0025 • Trailing zeros without a decimal point -- 2,500 Courtesy Christy Johannesson www.nisd.net/communicationsarts/pages/chem
Significant Figures Counting Sig Fig Examples 1. 23.50 1. 23.50 4 sig figs 3 sig figs 2. 402 2. 402 3. 5,280 3. 5,280 3 sig figs 2 sig figs 4. 0.080 4. 0.080 Courtesy Christy Johannesson www.nisd.net/communicationsarts/pages/chem
3 SF Significant Figures • Calculating with Sig Figs • Multiply/Divide - The # with the fewest sig figs determines the # of sig figs in the answer. (13.91g/cm3)(23.3cm3) = 324.103g 4 SF 3 SF 324g Courtesy Christy Johannesson www.nisd.net/communicationsarts/pages/chem
Significant Figures • Calculating with Sig Figs (con’t) • Add/Subtract - The # with the lowest decimal value determines the place of the last sig fig in the answer. 224 g + 130 g 354 g 224 g + 130 g 354 g 3.75 mL + 4.1 mL 7.85 mL 3.75 mL + 4.1 mL 7.85 mL 350 g 7.9 mL Courtesy Christy Johannesson www.nisd.net/communicationsarts/pages/chem
Significant Figures • Calculating with Sig Figs (con’t) • Exact Numbers do not limit the # of sig figs in the answer. • Counting numbers: 12 students • Exact conversions: 1 m = 100 cm • “1” in any conversion: 1 in = 2.54 cm Courtesy Christy Johannesson www.nisd.net/communicationsarts/pages/chem
(15.30 g) ÷ (6.4 mL) 2.4 g/mL 2 SF Significant Figures Practice Problems 4 SF 2 SF = 2.390625 g/mL 18.9 g - 0.84 g 18.1 g 18.06 g Courtesy Christy Johannesson www.nisd.net/communicationsarts/pages/chem
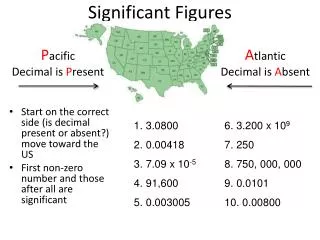
Scientific Notation • Converting into scientific notation: • Move decimal until there’s 1 digit to its left. Places moved = exponent. • Large # (>1) positive exponentSmall # (<1) negative exponent • Only include sig. figs. 65,000 kg 6.5 × 10⁴ kg Courtesy Christy Johannesson www.nisd.net/communicationsarts/pages/chem
7. 2,400,000 g 8. 0.00256 kg 9. 7 10-5 km 10. 6.2 104 mm Scientific Notation Practice Problems 2.4 106 g 2.56 10-3 kg 0.00007 km 62,000 mm Courtesy Christy Johannesson www.nisd.net/communicationsarts/pages/chem
EXE EXP EXP ENTER EE EE Scientific Notation • Calculating with scientific notation (5.44 × 10⁷ g) ÷ (8.1 × 10⁴ mol) = Type on your calculator: 5.44 7 8.1 4 ÷ = 671.6049383 = 670 g/mol = 6.7 × 10² g/mol Courtesy Christy Johannesson www.nisd.net/communicationsarts/pages/chem
y y x x Proportions • Direct Proportion • Inverse Proportion Courtesy Christy Johannesson www.nisd.net/communicationsarts/pages/chem
Rules for Counting Significant Figures 1. Nonzero integers always count as significant figures. 2. Zeros: There are three classes of zeroes. • Leading zeroes precede all the nonzero digits and DO NOT count as • significant figures. Example: 0.0025 has ____ significant figures. • Captive zeroes are zeroes between nonzero numbers. These always • count as significant figures. Example: 1.008 has ____ significant figures. • Trailing zeroes are zeroes at the right end of the number. • Trailing zeroes are only significant if the number contains a decimal point. • Example: 1.00 x 10² has ____ significant figures. • Trailing zeroes are not significant if the number does not contain a decimal • point. Example: 100 has ____ significant figure. • Exact numbers, which can arise from counting or definitions such as 1 in • = 2.54 cm, never limit the number of significant figures in a calculation. 2 4 3 1 Ohn-Sabatello, Morlan, Knoespel, Fast Track to a 5 Preparing for the AP Chemistry Examination2006, page 53