Download
1 / 13
140 likes | 276 Vues
This study investigates the impact of Asian biomass burning on ozone (O3) concentrations over North America during the Spring ARCTAS 2008 campaign. Utilizing various measurement platforms including satellites and aircraft, the research quantifies the influence of emissions from Kazakhstan, Siberia, and Southeast Asia on tropospheric O3 levels. Findings reveal that these fires can contribute significantly to atmospheric changes, impacting air quality and the greenhouse gas effect across regions. This work underscores the complex interplay of chemical and dynamical processes in the atmosphere.

E N D
Reconstructing ozone chemistry from Asian fires using satellite and aircraft measurements (Spring ARCTAS 2008) Richard Dupont 1, John Worden 1, Brad Pierce 2, Johnathan Hair 3, Marta Fenn 3, Paul Hamer 1, Murali Natarajan 3, Todd Schaack 4, Allen Lenzen 4, Eric Apel 5, Jack Dibb 6, Glenn Diskin 3 and Andrew Weinheimer 5 1. Jet Propulsion Laboratory/Caltech, Pasadena, CA, USA 2. NOAA/NESDIS/STAR, Madison, WI, USA 3. NASA Langley Research Center, Hampton, VI, USA 4. Space Science and Engineering Center, University of Wisconsin, Madison, WI, USA 5. National Center for Atmospheric Research, Boulder, CO, USA 6. University of New Hampshire - EOS, Durham, NH, USA
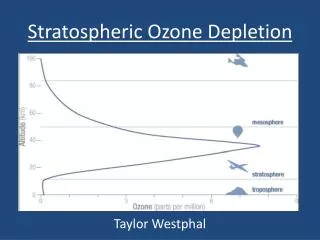
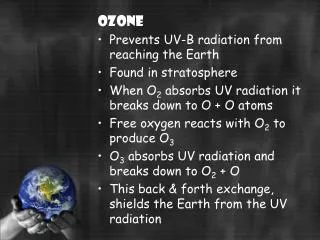
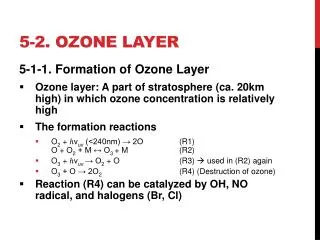
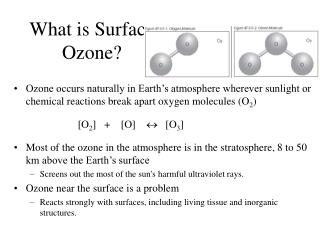
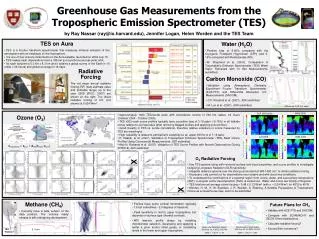
Ozone (O3) HONO HONO2 HO2NO2 HOx hv NO2 O(3P) NO O2 H2O H2O2 ROOH O3 + hv O1D OH HO2/RO2 O2 CO/CH4/VOC An important source of hydroxyl radicals (HOx), the “detergent” of the atmosphere; The third most important greenhouse gas in the atmosphere (IPCC, 2007).
Global biomass burning emissions Wildfire emissions affect atmospheric composition at a global scale (Andreae, 1983; Reichle et al, 1986, Fishman et al., 1990, Soja et al., 2006); Biomass burning emissions appear to be comparable to fossil fuel emissions(Seiler and Crutzen, 1980; Crutzen and Andreae, 1990); Asian biomass burning emissions • Asian fires = 10% of global bb C emissions (Van der Werf et al., 2006); • Important role in tropospheric CO variability and magnitude in the Northern Hemisphere (Novelli et al., 2003; Edwards et al., 2004; Kasischke et al., 2005; Pfister et al., 2005; Nedelec et al., 2005); • Influence troposphericO3 concentrations over North America (Jaffe et al., 2004; Bertschi and Jaffe, 2005; Morris et al., 2006), the Arctic (Warnecke et al., 2008) and even Europe (Simmonds et al., 2005). • Fires impact on tropospheric O3 concentrations is challenging to estimate. O3 production depends on aerosols (photochemical production) as well as highly variable PAN and NOx emissions and the cycling between these species (Mauzerall et al., 1996; Lapina et al., 2006; Val Martin et al., 2006; Real et al., 2007; Verma et al., 2009).
Goals Quantifying the impact of Asian fires on O3 concentrations over North America during the Spring ARCTAS 2008 campaign; Identifying the chemical and dynamical processes involved during the transport of biomass burning plumes over the Pacific ocean.
Spring ARCTAS: April 2008 ARCTAS Warm conveyor belt • Multiple types of measurement platforms: • Aircraft (NASA DC8, …) • Satellites (TES, OMI, MODIS, … • Ground-based measurements • Sondes (ARCIONS) MODIS fire count • 3 regions of major fire activity in the mid-northern latitudes: • Kazakhstan • Siberia • South East Asia (Thailand) High fire activity over Asian boreal region in April 2008 (Fisher et al., 2010)
CO2 O3 H2O, N2O TES TES = infrared Fourier Transform Spectrometer Spectral range = 650-2250 cm-1 Nadir footprint = 5.3 km (across-track) × 8.5 km (along track) (Beer et al., 2001) O3 vertical resolution = about 6 km Main sensitivity = middle troposphere NASA/DC8 aircraft data Ozone (O3) and Aerosol Scattering Ratio (ASR) = Differential Absorption Lidar Carbon monoxide (CO) = Spectrometer and photometer Sulfur dioxide (SO2) = Chemical Ionization Mass Spectrometer Black Carbon (BC) =Particle photometer Nitrogen Oxides (NOx) + PeroxyAcetyl Nitrate (PAN) = NCAR NOxyO3 Hydrogen CyaNide (HCN) =Chemical Ionization Mass Spectrometer RAQMS(Pierce et al., JGR, 2007) Developed by UW-Madison and NASA Langley Global 3D model Assimilation and forecast of chemistry and aerosols including STE Spatial resolution : 2°×2° 35 vertical levels (max 60km) Temporal resolution : 6h
Long range transport Thailand plume ASR O3 Kazakhstan/Siberian plume
Chemistry The lower/middle tropospheric plume has a biomass burning origin;
Fires impact over Northwestern America Kazakhstan and Siberian fires increase background concentrations of CC, CO and O3 respectively by 4 ppbv, 50 ppbv and nearly 9 ppbv in the lower troposphere; Thailand fires increase background concentrations of CC, CO and O3 respectively by 2 ppbv, 70 ppbv and nearly 10 ppbv in the upper troposphere;
Conclusion The stratosphere appears to be the main contributor of O3concentrations in Asian biomass burning plumes during spring. However, photochemistry also plays an important role; After transport over the Pacific, Thailand and Kazakhstan fires increase tropospheric O3 concentrations of about 10 ppbv relative to background levels; The Asian fires can contribute to about 10-15% of the tropospheric O3 concentrations measured over the west coast of North America.