Download
1 / 102
1.03k likes | 1.07k Vues
Understand classical hypothesis testing theory with 5 steps, significance points, Neyman-Pearson Lemma, most powerful procedure, examples, composite tests, and parameter spaces. Adapted from Alexander Senf Review.

E N D
Classical Hypothesis Testing Theory Adapted from Alexander Senf
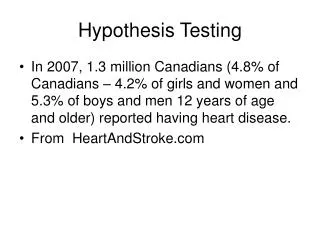
Review • 5 steps of classical hypothesis testing (Ch. 3) • Declare null hypothesis H0 and alternate hypothesis H1 • Fix a threshold α for Type I error (1% or 5%) • Type I error (α): reject H0 when it is true • Type II error (β): accept H0 when it is false • Determine a test statistic • a quantity calculated from the data
Review • Determine what observed values of the test statistic should lead to rejection of H0 • Significance point K (determined by α) • Test to see if observed data is more extreme than significance point K • If it is, reject H0 • Otherwise, accept H0
Overview of Ch. 9 • Simple Fixed-Sample-Size Tests • Composite Fixed-Sample-Size Tests • The -2 log λ Approximation • The Analysis of Variance (ANOVA) • Multivariate Methods • ANOVA: the Repeated Measures Case • Bootstrap Methods: the Two-sample t-test • Sequential Analysis
The Issue • In the simplest case, everything is specified • Probability distribution of H0 and H1 • Including all parameters • α (and K) • But: β is left unspecified • It is desirable to have a procedure that minimizes β given a fixed α • This would maximize the power of the test • 1-β, the probability of rejecting H0 when H1 is true
Most Powerful Procedure • Neyman-Pearson Lemma • States that the likelihood-ratio (LR) test is the most powerful test for a given α • The LR is defined as: • where • f0, f1 are completely specified density functions for H0,H1 • X1, X2, … Xn are iid random variables
Neyman-Pearson Lemma • H0 is rejected when LR ≥ K • With a constant K chosen such that: P(LR ≥ K when H0 is true) = α • Let’s look at an example using the Neyman-Pearson Lemma! • Then we will prove it.
Example • Basketball players seem to be taller than average • Use this observation to formulate our hypothesis H1: • “Tallness is a factor in the recruitment of KU basketball players” • The null hypothesis, H0, could be: • “No, the players on KU’s team are a just average height compared to the population in the U.S.” • “Average height of the team and the population in general is the same”
Example • Setup: • Average height of males in the US: 5’9 ½“ • Average height of KU players in 2008: 6’04 ½” • Assumption: both populations are normal-distributed centered on their respective averages (μ0 = 69.5 in, μ1 = 76.5 in) and σ = 2 • Sample size: 3 • Choose α: 5%
Example • The two populations: f0 f1 p height (inches)
Example • Our test statistic is the Likelihood Ratio, LR • Now we need to determine a significance point K at which we can reject H0, given α = 5% • P(Λ(x) ≥ K | H0 is true) = 0.05, determine K
Example • So we just need to solve for K’ and calculate K: • How to solve this? Well, we only need one set of values to calculate K, so let’s pick two and solve for the third: • We get one result: K3’=71.0803
Example • Then we can just plug it in to Λ and calculate K:
Example • With the significance point K = 1.663*10-7 we can now test our hypothesis based on observations: • E.g.: Sasha = 83 in, Darrell = 81 in, Sherron = 71 in • 1.446*1012 > 1.663*10-7 • Therefore, our hypothesis that tallness is a factor in the recruitment of KU basketball players is true.
Neyman-Pearson Proof • Let A define region in the joint range of X1, X2, … Xn such that LR ≥ K. A is the critical region. • If A is the only critical region of size α we are done • Let’s assume another critical region of size α, defined by B
Proof • H0 is rejected if the observed vector (x1, x2, …, xn) is in A or in B. • Let A and B overlap in region C • Power of the test: rejecting H0 when H1 is true • The Power of this test using A is:
Proof • Define: Δ = ∫AL(H1) - ∫BL(H1) • The power of the test using A minus using B • Where A\C is the set of points in A but not in C • And B\C contains points in B but not in C
Proof • So, in A\C we have: • While in B\C we have: Why?
Proof • Thus • Which implies that the power of the test using A is greater than or equal to the power using B.
Not Identically Distributed • In most cases, random variables are not identically distributed, at least not in H1 • This affects the likelihood function, L • For example, H1 in the two-sample t-test is: • Where μ1 and μ2 are different
Composite • Further, the hypotheses being tested do not specify all parameters • They are composite • This chapter only outlines aspects of composite test theory relevant to the material in this book.
Parameter Spaces • The set of values the parameters of interest can take • Null hypothesis: parameters in some region ω • Alternate hypothesis: parameters in Ω • ω is usually a subspace of Ω • Nested hypothesis case • Null hypothesis nested within alternate hypothesis • This book focuses on this case • “if the alternate hypothesis can explain the data significantly better we can reject the null hypothesis”
λ Ratio • Optimality theory for composite tests suggests this as desirable test statistic: • Lmax(ω): maximum likelihood when parameters are confined to the region ω • Lmax(Ω): maximum likelihood when parameters are confined to the region Ω, defined by H1 • H0 is rejected when λ is sufficiently small (→ Type I error)
Example: t-tests • The next slides calculate the λ-ratio for the two sample t-test (with the likelihood) • t-tests later generalize to ANOVA and T2 tests
Equal Variance Two-Sided t-test • Setup • Random variables X11,…,X1m in group 1 are Normally and Independently Distributed (μ1,σ2) • Random variables X21,…,X2n in group 2 are NID (μ2,σ2) • X1i and X2j are independent for all i and j • Null hypothesis H0: μ1= μ2 (= μ, unspecified) • Alternate hypothesis H1: both unspecified
Equal Variance Two-Sided t-test • Setup (continued) • σ2 is unknown and unspecified in H0 and H1 • Is assumed to be the same in both distributions • Region ω is: • Region Ω is:
Equal Variance Two-Sided t-test • Derivation • H0: writing μ for the mean, when μ1= μ2, the maximum over likelihood ω is at • And the (common) variance σ2 is
Equal Variance Two-Sided t-test • Inserting both into the likelihood function, L
Equal Variance Two-Sided t-test • Do the same thing for region Ω • Which produces this likelihood Function, L
Equal Variance Two-Sided t-test • The test statistic λ is then It’s the same function, just With different variances
Equal Variance Two-Sided t-test • We can then use the algebraic identity • To show that • Where t is (from Ch. 3)
Equal Variance Two-Sided t-test • t is the observed value of T • S is defined in Ch. 3 as λ We can plot λ as a function of t: (e.g. m+n=10) t
Equal Variance Two-Sided t-test • So, by the monotonicity argument, we can use t2 or |t| instead of λ as test statistic • Small values of λ correspond to large values of |t| • Sufficiently large |t| lead to rejection of H0 • The H0 distribution of t is known • t-distribution with m+n-2 degrees of freedom • Significance points are widely available • Once α has been chosen, values of |t| sufficiently large to reject H0 can be determined
Equal Variance Two-Sided t-test http://www.socr.ucla.edu/Applets.dir/T-table.html
Equal Variance One-Sided t-test • Similar to Two-Sided t-test case • Different region Ω for H1: • Means μ1 and μ2 are not simply different, but one is larger than the other μ1 ≥ μ2 • If then maximum likelihood estimates are the same as for the two-sided case
Equal Variance One-Sided t-test • If then the unconstrained maximum of the likelihood is outside of ω • The unique maximum is at , implying that the maximum in ω occurs at a boundary point in Ω • At this point estimates of μ1 and μ2 are equal • At this point the likelihood ratio is 1 and H0 is not rejected • Result: H0 is rejected in favor of H1 (μ1 ≥ μ2) only for sufficiently large positive values of t
Example - Revised • This scenario fits with our original example: • H1 is that the average height of KU basketball players is bigger than for the general population • One-sided test • We could assume that we don’t know the averages for H0 and H1 • We actually don’t know σ (I just guessed 2 in the original example)
Example - Revised • Updated example: • Observation in group 1 (KU): X1 = {83, 81, 71} • Observation in group 2: X2 = {65, 72, 70} • Pick significance point for t from a table: tα = 2.132 • t-distribution, m+n-2 = 4 degrees of freedom, α = 0.05 • Calculate t with our observations • t > tα, so we can reject H0!
Comments • Problems that might arise in other cases • The λ-ratio might not reduce to a function of a well-known test statistic, such as t • There might not be a unique H0 distribution of λ • Fortunately, the t statistic is a pivotal quantity • Independent of the parameters not prescribed by H0 • e.g. μ, σ • For many testing procedures this property does not hold
Unequal Variance Two-Sided t-test • Identical to Equal Variance Two-Sided t-test • Except: variances in group 1 and group 2 are no longer assumed to be identical • Group 1: NID(μ1, σ12) • Group 2: NID(μ2, σ22) • With σ12 and σ22 unknown and not assumed identical • Region ω = {μ1 = μ2, 0 < σ12, σ22 < +∞} • Ω makes no constraints on values μ1, μ2, σ12, and σ22
Unequal Variance Two-Sided t-test • The likelihood function of (X11, X12, …, X1m, X21, X22, …, X2n) then becomes • Under H0 (μ1 = μ2 = μ), this becomes:
Unequal Variance Two-Sided t-test • Maximum likelihood estimates , and satisfy the simultaneous equations:
Unequal Variance Two-Sided t-test • cubic equation in • Neither the λ ratio, nor any monotonic function has a known probability distribution when H0 is true! • This does not lead to any useful testing statistic • The t-statistic may be used as reasonably close • However H0 distribution is still unknown, as it depends on the unknown ratio σ12/σ22 • In practice, a heuristic is often used (see Ch. 3.5)
The -2 log λ Approximation • Used when the λ-ratio procedure does not lead to a test statistic whose H0 distribution is known • Example: Unequal Variance Two-Sided t-test • Various approximations can be used • But only if certain regularity assumptions and restrictions hold true
The -2 log λ Approximation • Best known approximation: • If H0 is true, -2 log λ has an asymptotic chi-square distribution, • with degrees of freedom equal to the difference in parameters unspecified by H0 and H1, respectively. • λ is the likelihood ratio • “asymptotic” = “as the sample size → ∞” • Provides an asymptotically valid testing procedure
The -2 log λ Approximation • Restrictions: • Parameters must be real numbers that can take on values in some interval • The maximum likelihood estimator is found at a turning point of the function • i.e. a “real” maximum, not at a boundary point • H0 is nested in H1 (as in all previous slides) • These restrictions are important in the proof • I skip the proof…
The -2 log λ Approximation • Instead: • Our original basketball example, revised again: • Let’s drop our last assumption, that the variance in the population at large is the same as in the group of KU basketball players. • All we have left now are our observations and the hypothesis that μ1 > μ2 • Where μ1 is the average height of Basketball players • Observation in group 1 (KU): X1 = {83, 81, 71} • Observation in group 2: X2 = {65, 72, 70}