Download
1 / 15
160 likes | 245 Vues
Explore the latest research on subglacial water flow dynamics in West Antarctica, including elevation anomalies, water fluxes, and implications for ice stream behavior and sea-level rise. Learn how Elevation Change Anomalies serve as crucial gauges for understanding these processes.

E N D
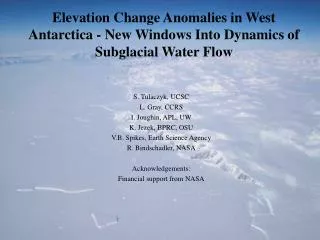
Elevation Change Anomalies in West Antarctica - New Windows Into Dynamics of Subglacial Water Flow S. Tulaczyk, UCSC L. Gray, CCRS I. Joughin, APL, UW K. Jezek, BPRC, OSU V.B. Spikes, Earth Science Agency R. Bindschadler, NASA Acknowledgements: Financial support from NASA
Bindshadler Ice Stream Margin (N. Nereson) What causes fast ice motion?Lubrication of the bed by water. Borehole drill and drillers (A. Behar) Borehole to the ice stream bed (A. Behar)
Until recently the theory of subglacial water flow assumed that meltwater gradually trickles from areas of basal melting to areas of basal freezing Joughin, MacAyeal, Tulaczyk (2004)
Recent satellite and airborne measurements of ice surface elevation changes suggest that water collects in, and drains from, small subglacial lakes Area A1 includes an area of the Kamb Ice Stream (“C”). Area A2 includes a tributary of the Bindschadler Ice Stream (“D”). L1 and L2 are lidar flight lines flown by SOAR in 1998 and 2000. Gray and others, 2005
Gray and others, 2005 Airborne laser altimetry shows localized surface uplifts and depressions. Data from Spikes et al. Thickness changes on Whillans Ice Stream and Ice Stream C, West Antarctica, derived from laser altimeter measurements. J. Glaciol. 49, 165, 2003. Lidar data courtesy of the SOAR facility, U Texas, and NSF.
A A: Horizontal velocity field interpolated from repeated GPS measurements*. B: This was used to estimate the 24-day horizontal displacements which was then combined with the radar line-of-sight displacement from an interferometric pair (from Sept. 26 and Oct. 20, 1997) to derive the local vertical displacement. The red and blue areas represent uplift and subsidence, respectively. * Chen, X., Bindschadler, R. A. & Vornberger, P. L. Determination of velocity field and strain-rate field in West Antarctica using high precision GPS measurements. Surveying and Land Information Systems. 58, 247-255 (1998). B Gray and others, 2005
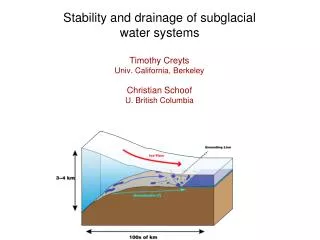
Link to Subglacial water system… All elevation-change anomalies occur at regions of ‘reversed’ slopes, the features are on or just upstream from ice moving slightly ‘uphill’. This suggests that subglacial water could ‘pond’ in the hydrologic potential well defined primarily by the surface slopes. Assuming that initially inflow exceeds outflow then the surface could be lifted as water collects.Drainage of these small subglacial lakes requires discharge of up to ~0.3 cubic kilometers of water, which is similar to the total estimated annual water production in an individual drainage basin. Increased pressure on bed due to ice rigidity
ECA = Water volume gauge Incredibly Amazing Fact #1! As water volume changes, ice lid flexes => we can measure subglacial water fluxes by looking at ECAs … it gets even better … ECA = Pressure gauge Incredibly Amazing Fact #2! As water volume changes, ice lid flexes => ice surface level is a proxy for water pressure (elastic fiber stresses support part of ice weight)
System of two coupled Ordinary Differential Equations describing temporal evolution of depression depth and outflow conduit diameter:
Theory of subglacial lake drainage indicates that such drainage should take form of relatively rapid ‘subglacial floods’
Output looks very much ‘jokulhlaup-ish’ - long periods of filling are followed by short periods of drainage
Large Antarctic subglacial lakes ~10,000 cubic km (Dowdeswell and Siegert, 2003) Q: Do they drain catastrophically? A: Great question! Largest historic floods were subglacial floods in Iceland (~3 cubic km of water discharged in a single event)
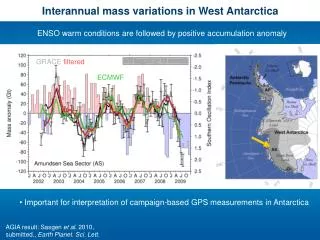
Q: Is rapidly varying subglacial water flow forcing ice flow to vary?A: Another great question! If yes, we have to re-evaluate our predictions.Kamb Ice Stream may restart if re-lubricated by water. Whillans Ice Stream may reverse its slow down. Our assessment of future drainage from other ice streams may be change as well. Possibly greater contribution of Antarctica to near-future sea-level rise. Image courtesy of Ian Joughin, JPL (red colors ~1000 of m/yr, blue ~100 m/yr, yellowish-green ~10 m/yr
Take home messagesECAs can be used as gauges of subglacial water flux and pressureThey provide cheap windows into a problem that is difficult to constrain otherwise but crucial to understanding WAIS behavior