Download
1 / 25
270 likes | 508 Vues
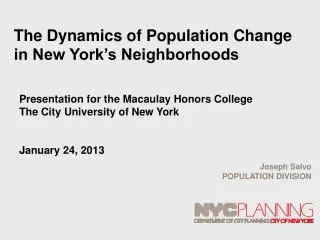
The Dynamics of Population Change in New York’s Neighborhoods. Presentation for the Macaulay Honors College The City University of New York January 24, 2013. Joseph Salvo POPULATION DIVISION. The Population Dynamic. Population Change for the 10 Largest Cities in the U.S., 2000 to 2010

E N D
The Dynamics of Population Change in New York’s Neighborhoods Presentation for the Macaulay Honors College The City University of New York January 24, 2013 Joseph Salvo POPULATION DIVISION
Population Change for the 10 Largest Cities in the U.S., 2000 to 2010 Ranked by Population in 2010 *Achieved population peak in 2010 Source: U.S. Census Bureau, 2000 and 2010 Census PL 94-171 Files Population Division-New York City Department of City Planning
Population ChangeNew York City and Boroughs, 2010-2011 Source: U.S. Census Bureau: 2010 Census-Summary File 1 and 2011 Population Estimates Program Population Division-New York City Department of City Planning
Population Change Natural Increase Net Migration Net International Migration Net Domestic Migration Estimated Components of Population ChangeNew York City, 2010-2011 Thousands Source: U.S. Census Bureau, 2011 Estimates Program as revised by Population Division-New York City Department of City Planning
Total Population by NativityNew York City, 1970 to 2010 Percent Foreign-born 6,457,740 1,437,058 18.2 5,401,440 1,670,199 23.6 28.4 5,239,633 2,082,931 35.9 5,137,246 2,871,032 37.2 5,142,584 3,042,315 Source: U.S. Census of Population, 1970 to 2000; 2010 American Community Survey-Full Sample Population Division-New York City Department of City Planning
Top Countries of Birth for the Foreign-bornNew York City and United States, 2010 New York City United States Total = 39,955,673 Total = 3,042,315 * Includes Hong Kong and Taiwan Source: U.S. Census Bureau, 2010 American Community Survey-FactFinder Population Division-New York City Department of City Planning
Population Distribution by Race/Hispanic OriginNew York City and Boroughs, 2010 Source: U.S. Census Bureau: 2010 Census-Summary File 1 Population Division-New York City Department of City Planning
Hispanic and Asian SubgroupsNew York City, 2010 Hispanic Asian* Total = 2,336,076 Total = 1,038,388 *Includes a small number of Asians who are of Hispanic origin. ** Includes Taiwanese Source: U.S. Census Bureau, 2010 Census-Summary File 1 Population Division-New York City Department of City Planning
Population by Hispanic SubgroupNew York City, 2000-2010 Percent Change = -11.2 8.2 73.7 14.9 7.9 -11.7 -8.5 10.1 Source: U.S. Census Bureau, 2000 Simulated Hispanic File; 2010 Census-Summary File 1 Population Division-New York City Department of City Planning
Population by Asian SubgroupNew York City, 2000-2010 Percent Change = 34.6 12.5 11.9 22.4 73.8 177.7 Source: U.S. Census Bureau, 2000 and 2010 Censuses-Summary File 1 Population Division-New York City Department of City Planning
Neighborhood Tabulation Areas* New York City, 2010 N Riverdale Woodlawn Fieldston Wakefield Riverdale Willmsbridge Olinville Spuyten Duyvil Kingsbridge Eastchstr Norwood Ednwld Co-Op City V CortlandtVlg Baychstr Marble Hl Bedfrd Pk Inwood Fordhm N Kingsbridge Hts Bronxdale Allerton Pelham Gdns Fordhm S Belmont Wash Hts N Pelham Pkwy University Hts Morris Hts Van Nest Mt Hope Pelham Bay Morris Pk Country Club E Tremont Westchtr Sq Clarmnt City Island Bathgate Wash Hts S Highbridge Parkchstr Crotona Pk E W Farms E Conc Westchstr Bronx Riv ConcVlg Unionprt W Conc Morrisania Soundview Hamilton Hts Melrose Bruckner Schuylerville Throgs Nck Soundview Edgewater Pk Manhattanville Longwood Melrose S Castle Hl Central Hrlm N Mott Haven N Clason Pt Polo Grnds Harding Pk Hunts Pt Mott Haven Morningside Hts Prt Morris Central Hrlm S E Hrlm N Rikers Island Upper W Side E Hrlm S Whitestone Ft Totten Bay Ter Clearvw College Pt Steinway Yorkville Lincoln Sq Upper E Side Carnegie Hl Old Astoria Murray Hl Lenox Hl Roosevelt Is Clinton Douglas Mnr Bayside Douglaston Flushing Midtown Astoria E Elmhurst Bayside Hls Little Nck Midtown S Jackson Hts Queensbridge Turtle Bay Ravenswood E Flushing E Midtown N Corona LIC Hudson Yrds Chelsea Glen Oaks Flat Iron Floral Pk Woodside Murray Hl Auburndale Elmhurst Union Sq New Hyde Pk Queensboro Hl Kips Bay Oakland Gdns Hunters Pt Corona Sunnyside Elmhurst W Maspeth Maspeth Gramercy Fresh Mdws Bellerose Pomonok Utopia W Vlg Stuy Town Flushing Hts Cooper Vlg Hillcrest Greenpoint Rego Pk E Vlg Maspeth Kew Gdns Hls SoHo TriBeCa Forest Hls Jamaica Ests Civic Ctr Middle Vlg Holliswood Lower E Side Little Italy Queens Vlg N Side E Williamsburg Chinatown S Side Briarwood Hollis Jamaica Hls Battery Pk City Kew Gdns Lower MN DUMBO Ridgewood Jamaica Vinegar Hl Williamsburg Glendale Dwntwn BK Boerum Hl Bushwick N BK Hts Richmond Hl S Jamaica Cambria Hts Cobble Hl Bushwick S Bedford St Albans Ft Greene Woodhaven Stuyvesant Hts Cypress Hls Clinton Hl City Line Carroll Gdns Baisley Pk Columbia St Prospect Hts Ocean Hl Ozone Pk S Ozone Pk Laurelton Red Hook Crown Hts N Pk Slope Springfield Gdns N Gowanus Crown Hts S E New York (PA Ave) Brownsville Springfield Gdns S Brookville Prospect Lffrts Gdns E New York Lindenwood Wingate Rosedale Howard Bch Rugby Windsor Ter Remsen Vlg Sunset Pk W Starrett City Erasmus Flatbush W New Brighton Sunset Pk E New Brighton Kensington St George Ocean Pkwy E Flatbush Farragut Canarsie Mariner's Hbr Arlington Prt Richmond New Brighton Borough Pk Prt Ivory Silver Lake Graniteville Flatlands Grgtwn Bay Rdg Marine Pk Dyker Hts Bergen Bch Midwood Grymes Hl Mill Basin Clifton Ocean Pkwy S Westerleigh Fox Hls Bensonhurst W Stapleton Rosebank Madison New Springville Bath Bch Far Rckwy Bloomfield Grasmere Bayswater Bensonhurst E Travis Arrochar Ft Wadsworth Hammels Homecrest Arverne Edgemere Sheepshead Bay Old Town Gravesend Gerritsen Bch Dongan Hls MN Bch Todt Hl S Bch Emerson Hl Heartlnd Vlg Brighton Bch Lghthouse Hl W Brighton Seagate Coney Is New Dorp Midland Bch Oakwood Oakwood Bch Breezy Pt Belle Hbr Rckwy Pk Arden Hts Broad Channel Great Kills Rossville Woodrow Annadale Huguenot Charleston Prince's Bay Richmond Vly Eltingvl Tottenville Bronx Manhattan Queens LAGUARDIA AIRPORT Brooklyn JOHN F. KENNEDY INTERNATIONAL AIRPORT Staten Island * Neighborhood Tabulation Areas or NTAs, are aggregations of census tracts that are subsets of New York City's 55 Public Use Microdata Areas (PUMAs). Primarily due to these constraints, NTA boundaries and their associated names may not definitively represent neighborhoods. Source: Population Division-New York City Department of City Planning
Population Growth by Race/Hispanic OriginNew York City, 2000-2010 Percent Change = 31.8 8.1 -5.1 -2.8 Sources: U.S. Census Bureau: 2000 and 2010 Censuses-Summary File 1 Population Division-New York City Department of City Planning
Percent Change in Population by Neighborhood Tabulation Area* New York City, 2000 to 2010 Bronx Gain of 15.0% or more (8 neighborhoods) 9.0% to 14.9% (25) 6.0% to 8.9% (17) (31) -2.9% to 2.9% (74) Manhattan Queens (17) -6.0% to -8.9% (10) -9.0% to -14.9% (6) LAGUARDIA AIRPORT Brooklyn JOHN F. KENNEDY INTERNATIONAL AIRPORT Staten Island Percent Change * Neighborhood Tabulation Areas or NTAs, are aggregations of census tracts that are subsets of New York City's 55 Public Use Microdata Areas (PUMAs). Primarily due to these constraints, NTA boundaries and their associated names may not definitively represent neighborhoods. Source: U.S. Census Bureau: 2000 and 2010 Censuses-Summary File 1 Population Division-New York City Department of City Planning 3.0% to 5.9% -3.0% to -5.9%
Percent Change in the Black Nonhispanic Population by Neighborhood Tabulation Area* New York City, 2000 to 2010 Bronx (3 neighborhoods) (9) (9) (19) Manhattan Queens (15) (23) (10) LAGUARDIA AIRPORT (1) Brooklyn JOHN F. KENNEDY INTERNATIONAL AIRPORT Staten Island Percent Change * Neighborhood Tabulation Areas or NTAs, are aggregations of census tracts that are subsets of New York City's 55 Public Use Microdata Areas (PUMAs). Primarily due to these constraints, NTA boundaries and their associated names may not definitively represent neighborhoods. 20.0% to 39.9% 10.0% to 19.9% Source: U.S. Census Bureau: 2000 and 2010 Censuses-Summary File 1 Population Division-New York City Department of City Planning 5.0% to 9.9% -4.9% to 4.9% -5.0% to -9.9% -10.0% to -19.9% -20.0% to -39.9% Loss of 40.0% or more Less than 5,000 Black NH in 2000 and 2010
Percent Change in the White Nonhispanic Population by Neighborhood Tabulation Area* New York City, 2000 to 2010 Bronx (18 neighborhoods) (4) (8) (11) (25) Manhattan Queens (16) (22) (29) LAGUARDIA AIRPORT LAGUARDIA AIRPORT (6) Brooklyn JOHN F. KENNEDY INTERNATIONAL AIRPORT Staten Island Percent Change Gain of 40.0% or more * Neighborhood Tabulation Areas or NTAs, are aggregations of census tracts that are subsets of New York City's 55 Public Use Microdata Areas (PUMAs). Primarily due to these constraints, NTA boundaries and their associated names may not definitively represent neighborhoods. 20.0% to 39.9% 10.0% to 19.9% Source: U.S. Census Bureau: 2000 and 2010 Censuses-Summary File 1 Population Division-New York City Department of City Planning 5.0% to 9.9% -4.9% to 4.9% -5.0% to -9.9% -10.0% to -19.9% -20.0% to -39.9% Loss of 40.0% or more Less than 5,000 White NH in 2000 and 2010
Percent Change in the Asian Nonhispanic Population by Neighborhood Tabulation Area* New York City, 2000 to 2010 Bronx (25 neighborhoods) (27) (5) (2) (2) Manhattan Queens (3) (1) LAGUARDIA AIRPORT Brooklyn JOHN F. KENNEDY INTERNATIONAL AIRPORT Staten Island Percent Change Gain of 40.0% or more * Neighborhood Tabulation Areas or NTAs, are aggregations of census tracts that are subsets of New York City's 55 Public Use Microdata Areas (PUMAs). Primarily due to these constraints, NTA boundaries and their associated names may not definitively represent neighborhoods. 20.0% to 39.9% 10.0% to 19.9% Source: U.S. Census Bureau: 2000 and 2010 Censuses-Summary File 1 Population Division-New York City Department of City Planning 5.0% to 9.9% -4.9% to 4.9% -5.0% to -9.9% -10.0% to -19.9% Less than 5,000 Asian NH in 2000 and 2010
Percent Change in the Hispanic Population by Neighborhood Tabulation Area* New York City, 2000 to 2010 Bronx (21 neighborhoods) (16) (24) (17) (24) Manhattan Queens (7) (14) (6) LAGUARDIA AIRPORT LAGUARDIA AIRPORT Brooklyn JOHN F. KENNEDY INTERNATIONAL AIRPORT Staten Island Percent Change Gain of 40.0% or more * Neighborhood Tabulation Areas or NTAs, are aggregations of census tracts that are subsets of New York City's 55 Public Use Microdata Areas (PUMAs). Primarily due to these constraints, NTA boundaries and their associated names may not definitively represent neighborhoods. 20.0% to 39.9% 10.0% to 19.9% Source: U.S. Census Bureau: 2000 and 2010 Censuses-Summary File 1 Population Division-New York City Department of City Planning 5.0% to 9.9% -4.9% to 4.9% -5.0% to -9.9% -10.0% to -19.9% -20.0% to -39.9% Less than 5,000 Hispanic in 2000 and 2010
Persons by English Language Ability New York City, 2010 Speaks language other than English at home 49% 3,781,160 Total Persons Ages 5 and Over = 7,670,643 Source: U.S. Census Bureau, 2010 American Community Survey-Public Use Microdata Sample Population Division-New York City Department of City Planning
Limited English Proficient Population by Language Spoken at HomeNew York City, 2010 * Includes Chinese, Cantonese, Mandarin, and Formosan Source: U.S. Census Bureau, 2010 American Community Survey-Public Use Microdata Sample Population Division-New York City Department of City Planning
Limited English Proficient Population for the Population 5 Years and over by Neighborhood Tabulation Area* New York City, 2006-2010 Percent 50.0% or more 40.0 % to 49.9% 30.0% to 39.9% 20.0% to 29.9% Less than 20% Bronx Manhattan Queens (9 neighborhoods) (12) (40) NYC Average = 23.4% (35) (92) Brooklyn Staten Island * Neighborhood Tabulation Areas or NTAs, are aggregations of census tracts that are subsets of New York City's 55 Public Use Microdata Areas (PUMAs). Primarily due to these constraints, NTA boundaries and their associated names may not definitively represent neighborhoods. Source: U.S. Census Bureau, 2006-2010 American Community Survey-FactFinder Population Division-New York City Department of City Planning
Selected Socioeconomic Characteristics of New York City’s Top 10 Foreign-born Groups, 2010 1 Includes Hong Kong and Taiwan 2 Persons 5 years and over 3 Persons 25 years and over Source: U.S. Census Bureau, 2010 American Community Survey-Public Use Microdata Sample Population Division- New York City Department of City Planning
Selected Socioeconomic Characteristics of New York City’s Top 10 Foreign-born Groups, 2010 1 Includes Hong Kong and Taiwan 4 Persons 16-64 years old Source: U.S. Census Bureau, 2010 American Community Survey-Public Use Microdata Sample Population Division- New York City Department of City Planning
Data Links • DCP Population Division Web site: www.nyc.gov/population • New York City Census FactFinder: http://gis.nyc.gov/dcp/pa/address.jsp • Census Bureau Web site: www.census.gov