Comparing Climate Emission Reduction Approaches: Balancing vs. Imperative Strategies
This analysis explores two primary approaches to reducing greenhouse gas emissions: the Balancing Approach, which weighs the marginal benefits and costs of emissions reduction, and the Imperative Approach, which focuses on maintaining greenhouse gas concentrations below a critical threshold to prevent drastic damage. The discourse contrasts perspectives in the U.S. and the EU, revealing differing views on discount rates, ethical considerations, and the assessment of future damages. California’s ambitious GHG regulations are highlighted as a leading effort in emission control, emphasizing the complexities and trade-offs in climate policy.

Comparing Climate Emission Reduction Approaches: Balancing vs. Imperative Strategies
E N D
Presentation Transcript
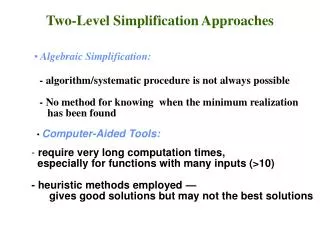
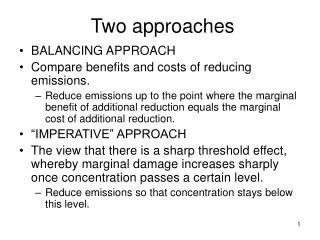
Two approaches • BALANCING APPROACH • Compare benefits and costs of reducing emissions. • Reduce emissions up to the point where the marginal benefit of additional reduction equals the marginal cost of additional reduction. • “IMPERATIVE” APPROACH • The view that there is a sharp threshold effect, whereby marginal damage increases sharply once concentration passes a certain level. • Reduce emissions so that concentration stays below this level.
The view in US vs EU • The EU is tending towards the imperative approach. • Mainstream opinion inside the Beltway in DC and among most American economists tends towards the balancing approach. • This reflects not only a different view of discounting but, also, a fundamentally different assessment of the underlying costs and benefits of reducing GHGs.
The force of discounting • With r = 4% (Nordhaus) $1 @100 years from now is worth $0.018 today $1 @ 200 years from now is worth $0.0003 today • With r = 1.4% (Stern) $1 @ 100 years from now is worth $0.25 today $1 @ 200 years from now is worth $0.06 today
Two observations • The choice of a discount rate to apply to climate policy is in part an ethical judgment, not purely a matter of economics. • With regard to the economics, there are two empirical assumptions the conventional economic analysis that seem incorrect. Altering them would lower the value of the interest rate, r.
Two questionable assumptions • (A) Climate change does not directly affect people’s wellbeing; it affects only the production of market goods. • If it did affect wellbeing directly, this would add an extra negative term to the formula for r • (B) People’s preferences do not change as they become richer; they don’t change their expectations to match their wealth. • If preferences do shift, the marginal utility of an extra dollar declines less, and r is lowered.
The difference isn’t just discounting It also involves the following: • Assessment of future damages • Stern’s assessment of these is much greater • Assessment of costs of emission reduction • Stern’s assessment of these is lower • Treatment of uncertainty • Stern includes allowance for risk aversion, views climate policy as partly a matter of insurance
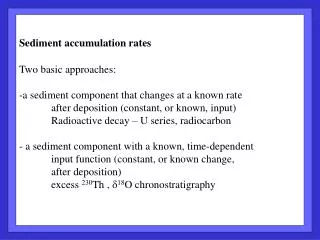
Damages from climate change: why DICE underestimates them • Some important categories of damage are omitted. • The categories of damage that are included are under-estimated. • There is excessive spatial and temporal aggregation; combined with nonlinearity and asymmetry of the damage relationship, this leads to understating damages.
Schlenker & Roberts (2006) Relation of Temperature and Crop Yield • Relationship is not symmetrical; it is distinctly asymmetric, fairly flat at first and then sharply declining beyond an upper threshold.
Uncertainty • There is a powerful argument that climate change should be viewed through the prism of risk management. • In that case, a key question is whether public policy should embody a degree of risk aversion. • There is a willingness to pay a premium to avoid dangerous risks. • These are mainly non-monetary, non-market outcomes, and cannot well be hedged in financial markets. • Stern allows for uncertainty and risk aversion, in a particular way. DICE does not. This is a major reason for their divergent assessments (Weitzman).
California’s 2006 GHG law • AB 32, places a cap on all GHG emissions in California; requires that, by 2020, these be reduced to their 1990 level. A reduction of ~29% compared to BAU in 2020, and 15% compared to 2005 emissions.
AB 1493 Imposes emissions cap on fleet of new model vehicles sold in California. • Enacted 2002; regulations issued 2004 • Near term (2009-2012): 22% reduction in GHG emissions (grams of CO2e/mile) • Mid-term (2013-2016): 30% reduction in GHG emissions • Low Carbon Fuel Standard: ≥ 10% emission reduction by 2020 • CPUC Carbon adder $8/ton • Million solar roof Initiative. $3.2B subsidies for solar, especially photovoltaic. • Renewable Portfolio Standard 20% by 2010, 33% by 2020 • SB 1368 Prohibits any load-serving entity from entering into long-term financial commitment for baseload generation unless GHG emissions are less than from new, combined-cycle natural gas.
Taken together, these are the most ambitious and comprehensive effort to control GHG emissions in force in the US. • They apply: • To all GHGs, not just CO2 (CO2 from fossil fuel combustion is 81% of all GHGs in CA) • To all sources, not just electric power plants (= 22% of all GHG emissions in CA). • The only other binding cap on emissions is Regional GHG Initiative in 9 northeastern states (RGGI). • RGGI applies only to GHG from electricity; target is to reduce emissions 10% below 2005 level by 2019.
The contrast with RGGI • A different inspiration • RGGI: SO2 emission trading under 1990 CAA • CA: 1988 California regulation of automotive air pollution emissions • A different approach • RGGI: emission trading • CA: Performance standards, efficiency standards, and also some emission trading
US Greenhouse Gas Emissions Source: EPA. 2002 Emissions, including CO2, CH4, N2O, HFCs, PFCs, and SF6.
California GHG Emissions (2002)6.2% of US GHG emissions; 1.2% of world’s emissions Source: CEC. Gross emissions only.
California’s unique history • California has a unique history, unlike that of any other state in the US, with regard to: • controlling air pollution from automobiles • regulating energy efficiency • In both cases, California pioneered regulatory approaches that were later copied by the federal government and applied to other states. • This experience provided the foundation for California’s new GHG initiative.
Air pollution • 1943 First smog episodes in Los Angeles. • 1947 Los Angeles County Air Pollution Control District (APCD) is established, the first in the nation. • 1959 State Department of Public Health to establish air quality standards and necessary controls for motor vehicle emissions. • 1960 Motor Vehicle Pollution Control Board is established to test and certify devices for installation on cars for sale in California • 1961 PVC emissions controls required for new cars in 1963. • 1966 Auto tailpipe emission standards for hydrocarbons and carbon monoxide, the first in the nation. California Highway Patrol begins random inspections of smog control devices. • 1967 California Air Resources Board (ARB) is created. • Federal Air Quality Act of 1967 enacted. Allows California a waiver to set its own emissions standards based on California's unique need for controls. Other states may copy California standard if they wish.
Since 1967 a waiver has been requested and granted, in whole or in part, 53 times – until now. These include • the first introduction of NOx standards for cars and light trucks (1971) • heavy-duty diesel truck standards (1973) • Two-way catalytic converters (1975) • unleaded gasoline (1976) • the low-emissions vehicles (LEV) program (1994 and 1998) • zero-emissions vehicles (1990) • evaporative emissions standards and test procedures (1999).
Air pollution control • The population of California grew from 21.5 million in 1975 to almost 35.5 million in 2005, and the vehicle miles traveled grew from about 389 million miles per day in 1980 to 873 million miles per day in 2005. • Yet, over this period, there has been a major reduction in the statewide emission of criteria air pollutants.
CARB Impact on Air Pollution Emissions in California (tons/day, annual average) Source: California Air Resources Board 2005 Almanac (web)
Energy efficiency • A distinctive feature of California over the last 30 years has been its regulatory approach to promoting energy efficiency through the California Energy Commission and the California Public Utility Commission. CPUC authority applies to investor-owned utilities; CEC to municipals as well. • The result has been a wave of regulation-induced technical change.
Energy Efficiency in California • In 1974, the California Energy Commission was created with five major responsibilities: • Forecasting future energy needs and keeping historical energy data • Licensing thermal power plants 50 megawatts or larger • Promoting energy efficiency through appliance and building standards • Developing energy technologies and supporting renewable energy • Planning for and directing state response to energy emergency • Since 1975, CEC has promulgated energy efficiency standards for buildings and energy-using appliances and equipment.
Inflation-adjusted price of refrigerators dropped from $1270 (1974) to $462 (2001)
California Public Utility Commission • Regulates investor-owned electric and gas utilities. • Has energetically pushed them to promote energy conservation. • Adopted rate decoupling for natural gas in 1978 and electricity in 1982. Ensures that utilities receive their expected revenue even if energy efficiency programs reduce their sales. • 2003 Energy Action plan establishes a “loading order” of preferred options for electricity : efficiency, renewables, natural gas.
Economic Cost • Analysis performed by my colleague David Roland-Holst assumes a mix of: • 8 specific regulatory policies • Building efficiency • Reduced motor vehicle emissions • HFC reduction • Semiconductors • Cement manufacturing • Landfill management • Manure management • Afforestation • emission trading • recycling of revenues from distribution of permits to fund into innovation investment
Finding for California • Meeting the 2020 goal is feasible • There are many possible strategies for lowering GHG emissions using existing or near-existing technologies. • This can be done at a moderate or no cost • Energy efficiency strategies promote economic growth and raise employment • Innovation investment also promotes economic growth and raises employment • However, substantial technological innovation will be required to meet the 2050 goal. This will require a significant policy effort aimed at promoting technology development.
The California Model: A Broad Vision • Need a portfolio of policy tools, including various regulatory initiatives aimed at specific sectors • Regulatory measures • Best Management Practices • Incentive Programs • Market-based mechanisms • A cap and trade system is essential, but it is only part of the solution, and not necessarily the most potent. • Because of sectoral differences and the need for longer-term technology development, a sectoral approach is essential, including downstream (sectoral) caps.