Download
1 / 16
160 likes | 302 Vues
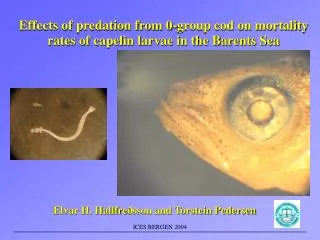
Effects of predation from 0-group cod on mortality rates of capelin larvae in the Barents Sea. Elvar H. Hallfre ðsson and Torstein Pedersen. OVERALL OBJECTIVES. Can predation from 0-group North-east arctic cod have a significant effect on mortality rates of the Barents Sea capelin larvae?.

E N D
Effects of predation from 0-group cod on mortality rates of capelin larvae in the Barents Sea Elvar H. Hallfreðsson and Torstein Pedersen ICES BERGEN 2004
OVERALL OBJECTIVES Can predation from 0-group North-east arctic cod have a significant effect on mortality rates of the Barents Sea capelin larvae? Part of a multi disciplinary project to study recruitment variability in the capelin stock (BASECOEX) ICES BERGEN 2004
DATA COLLECTION • Two surveys in June/July 2002 and 2003 • Pelagic trawl • Acoustics • Gulf III • CTD • Prey recognition experiments ICES BERGEN 2004
CAPELIN LARVA IN 23% OF COD STOMACHS Abundance of capelin larvae Catches of 0-group cod (circles) and percent frequency of capelin larvae in cod stomachs (numbers) ICES BERGEN 2004
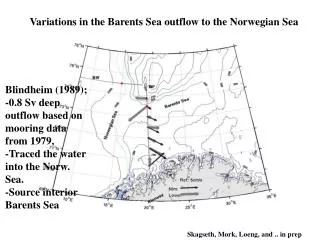
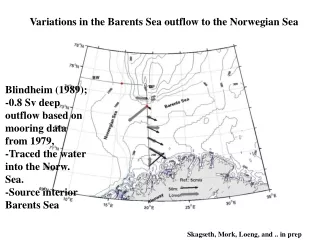
Firstcoverage 7.0 Juvenile cod 7.5 7.0 7.0 7.0 7.0 TEMPERATURE ISOCLINES 2002 Secondcoverage 7.5 8.0 6.5 7.0 7.5 7.0 7.5 Average for upper 50m ICES BERGEN 2004
Abundance of capelin larvae Catches of 0-group cod (circles) and percent frequency of capelin larvae in cod stomachs (numbers) CAPELIN LARVAE IN 9% OF COD STOMACHS ICES BERGEN 2004
5.5 6.0 5.0 5.5 6.0 6.5 5.5 5.0 5.5 5.5 TEMPERATURE ISOCLINES 2003 Average for upper 50m ICES BERGEN 2004
Numbers of capelin larvae in cod stomachs Numbers of Krill in cod stomachs Numbers of Copepods in cod stomachs Length of cod (cm) PREDATION IN RELATION TO COD LENGTH Data from the 2002 survey ICES BERGEN 2004
PREDATION MODEL INCLUDING EFFECTS OF ALTERNATIVE PREY Maximum likelihood fit, Poisson error distribution a = 0.0013 Concentration of capelin larvae increases numbers b = 0.682 Krill in the environment increases numbers c = -1.263 Copepods in the environment decreases numbers d = 0.150 Krill in the stomach increases numbers f = -0.112 Copepods in the stomach decreases numbers ICES BERGEN 2004
Average density of Copepods in 2002 Average density of krill in 2002 EFFECTS OF ALTERNATIVE PREY AT AVERAGE CAPELIN LARVAE ABUNDANCE (328 LARVAE / M2) Average numbers of capelin larvae per stomach Krill (n per m2/1000) Copepods (n per m2/10000) Data from the 2002 survey ICES BERGEN 2004
PREY RECOGNITION EXPERIMENT Cod juveniles were fed single capelin larvae and slaughtered at different times Time of 50% prey recognition was estimated by logistic regression For a 31mm long cod eating 10mm capelin larvae it was 75min, giving a digestion rate of D = 0.55 per hour ICES BERGEN 2004
MORTALITY Numbers eaten per predator per day Numbers of capelin larvae eaten per cod per day (average 2002 data) ICES BERGEN 2004
PREDATOR ABUNDANCE Densities of cod juveniles was estimated by acoustical echo integration for each station Target strength for the juvenile cod was determined as: TS = 20 log(L) – 70 ; Ona, E. 1994 ICES BERGEN 2004
Firstcoverage Secondcoverage 13.5 0.1 1.0 5.0 1.8 0.9 4.6 0.4 12.8 2.0 1.1 11.0 1.5 PERSENT CAPELIN LARVAE EATEN BY COD PER STATION PER DAY IN 2002 On average for all stations with overlap, 1.9% of the capelin larvae were eaten by cod per day ICES BERGEN 2004
Per capita predation was affected by abundance of euphausiids ( ) and copepods ( ) CONCLUSIONS - In years with spatial overlap and high densities of 0-group cod (as in 2002), predation might cause substantial mortality on capelin larvae in the Barents Sea - Capelin larva have low growth rates (2-3% per day) and the growth/mortality ratio may be reduced due to cod predation ICES BERGEN 2004
Number of cod stomachs analysed Number of capelin larvae in cod stomachs SOME COD HAD MANY CAPELIN LARVAE IN THE STOMACH ICES BERGEN 2004