Latest QCD Discoveries at Tevatron LHCP 2014 by Rick Field
230 likes | 257 Vues
Review the latest QCD advancements at the Tevatron LHCP 2014 conference, including measurements of photon-jet, W/Z, Upsilon, Z+c-jet, and more. Explore findings and surprises from the Tevatron Energy Scan and deep processes in g+jets. Engage with detailed data and theory comparisons, cross-section limits, and 9.7 fb-1 results. Discover insights into high transverse momentum jets and understand the underlying event in collider observations. Unveil the significance of UE observables for more precise collider measurements.

Latest QCD Discoveries at Tevatron LHCP 2014 by Rick Field
E N D
Presentation Transcript
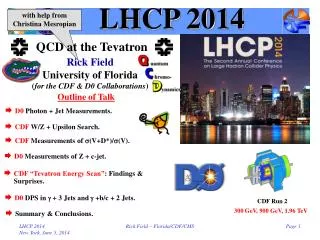
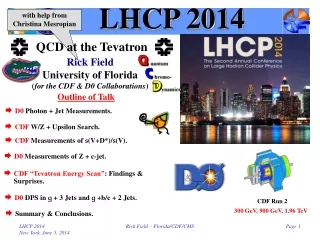
QCD at the Tevatron LHCP 2014 with help from Christina Mesropian Rick Field University of Florida (for the CDF & D0 Collaborations) Outline of Talk • D0 Photon + Jet Measurements. • CDF W/Z + Upsilon Search. • CDF Measurements of s(V+D*)/s(V). • D0 Measurements of Z + c-jet. • CDF “Tevatron Energy Scan”: Findings & Surprises. • D0 DPS in g + 3 Jets and g +b/c + 2 Jets. CDF Run 2 300 GeV, 900 GeV, 1.96 TeV • Summary & Conclusions. Rick Field – Florida/CDF/CMS
New since LHCP2013 Photon + Jet Production • D0 differential g + jet cross section as a function of pT(g) for four jet rapidity intervals, with central photons, |y| < 1.0, and forward photons, 1.5<|y|<2.5, for same-sign and opposite-sign of photon and jet rapidities. For presentation purposes, cross sections for |yjet| ≤ 0.8, 0.8 < |yjet| ≤ 1.6, 1.6 < |yjet| ≤ 2.4 and 2.4 < |yjet| ≤ 3.2 are scaled by factors of 5, 1, 0.3 and 0.1, respectively. The data are compared to the NLO QCD predictions using the jetphox with the CT10 PDF set and μR = μF = μf = pT(g) . Many Data/Theory Comparisons! Phys. Rev. D 88, 072008 (2013) 8.7 fb-1 Rick Field – Florida/CDF/CMS
~9 orders of magnitude Higgs ED In Search of Rare Processes Might get lucky! CDF and D0 continue to prob cross-sections ≈ 1 fb with 9.7 fb-1! PRODUCTION CROSS SECTION (fb) W’, Z’, T’ 1 fb Rick Field – Florida/CDF/CMS
New since LHCP2013 W/Z + Upsilon Search • CDF search for the production of the Upsilon (1S) meson in association with a vector boson. 9.7 fb-1 Observe one Upsilon + W candidate over an expected background of 1.2 ± 0.5 events, and one Upsilon + Z candidate over an expected background of 0.1 ± 0.1 events. 95% C.L. Cross Section Limits Rick Field – Florida/CDF/CMS
New since LHCP2013 Measurements of s(V+D*)/s(V) • CDF data for the differential rates of cross-section ratio σ(W + D*)/σ(W) as a function of pT (D*), as measured by in the W → eν (left) and W → μν (right) decay channels. The measurements show good agreement with PYTHIA 6.2 Tune A with (CTEQ5L) in all bins. 9.7 fb-1 Rick Field – Florida/CDF/CMS
New since LHCP2013 Measurements of Z + c-jet • D0 differential cross-sections measurements σZ+c-jet/σZ+jet (left) and σZ+c-jet/σZ+b-jet (right) as a function of pT(jet) (pT(jet) > 20 GeV, |ηjet| < 2.5). Best agreement is with PYTHIA with 1.7 × enchanced g → cc rate. 9.7 fb-1 Phys. Rev. Lett. 112, 042001 (2014) Rick Field – Florida/CDF/CMS
Tevatron Energy Scan • Just before the shutdown of the Tevatron CDF has collected more than 10M “min-bias” events at several center-of-mass energies! 900 GeV 300 GeV 1.96 TeV 300 GeV 12.1M MB Events 900 GeV 54.3M MB Events Rick Field – Florida/CDF/CMS
“Hard Scattering” Component QCD Monte-Carlo Models:High Transverse Momentum Jets • Start with the perturbative 2-to-2 (or sometimes 2-to-3) parton-parton scattering and add initial and final-state gluon radiation (in the leading log approximation or modified leading log approximation). “Underlying Event” • The “underlying event” consists of the “beam-beam remnants” and from particles arising from soft or semi-soft multiple parton interactions (MPI). The “underlying event” is an unavoidable background to most collider observables and having good understand of it leads to more precise collider measurements! • Of course the outgoing colored partons fragment into hadron “jet” and inevitably “underlying event” observables receive contributions from initial and final-state radiation. Rick Field – Florida/CDF/CMS
UE Observables • “transMAX” and “transMIN” Charged Particle Density: Number of charged particles (pT > 0.5 GeV/c, |h| < 0.8) in the the maximum (minimum) of the two “transverse” regions as defined by the leading charged particle, PTmax, divided by the area in h-f space, 2hcut×2p/6, averaged over all events with at least one particle with pT > 0.5 GeV/c, |h| < hcut. • “transMAX” and “transMIN” Charged PTsum Density: Scalar pT sum of charged particles (pT > 0.5 GeV/c, |h| < 0.8) in the the maximum (minimum) of the two “transverse” regions as defined by the leading charged particle, PTmax, divided by the area in h-f space, 2hcut×2p/6, averaged over all events with at least one particle with pT > 0.5 GeV/c, |h| < hcut. hcut = 0.8 Overall “Transverse” = “transMAX” + “transMIN” Note: The overall “transverse” density is equal to the average of the “transMAX” and “TransMIN” densities. The “TransDIF” Density is the “transMAX” Density minus the “transMIN” Density “Transverse” Density = “transAVE” Density = (“transMAX” Density + “transMIN” Density)/2 “TransDIF” Density = “transMAX” Density - “transMIN” Density Rick Field – Florida/CDF/CMS
“transMIN” & “transDIF” • The “toward” region contains the leading “jet”, while the “away” region, on the average, contains the “away-side” “jet”. The “transverse” region is perpendicular to the plane of the hard 2-to-2 scattering and is very sensitive to the “underlying event”. For events with large initial or final-state radiation the “transMAX” region defined contains the third jet while both the “transMAX” and “transMIN” regions receive contributions from the MPI and beam-beam remnants. Thus, the “transMIN” region is very sensitive to the multiple parton interactions (MPI) and beam-beam remnants (BBR), while the “transMAX” minus the “transMIN” (i.e. “transDIF”) is very sensitive to initial-state radiation (ISR) and final-state radiation (FSR). “TransMIN” density more sensitive to MPI & BBR. “TransDIF” density more sensitive to ISR & FSR. 0 ≤ “TransDIF” ≤ 2×”TransAVE” “TransDIF” = “TransAVE” if “TransMIX” = 3×”TransMIN” Rick Field – Florida/CDF/CMS
PTmax UE Data & Tunes • CDF PTmax UE Analysis: “Towards”, “Away”, “transMAX”, “transMIN”, “transAVE”, and “transDIF” charged particle and PTsum densities (pT > 0.5 GeV/c, |h| < 0.8) in proton-antiproton collisions at 300 GeV, 900 GeV, and 1.96 TeV (R. Field analysis). • CMS PTmax UE Analysis: “Towards”, “Away”, “transMAX”, “transMIN”, “transAVE”, and “transDIF” charged particle and PTsum densities (pT > 0.5 GeV/c, |h| < 0.8) in proton-proton collisions at 900 GeV and 7 TeV (Mohammed Zakaria Ph.D. Thesis, CMS PAS FSQ-12-020). arXiv:1307.5015 [hep-ph] • New Herwig++ Tune: M. Seymour and A. Siódmok have used the CDF UE data at 300 GeV, 900 GeV, and 1.96 TeV together with LHC UE data at 7 TeV to construct a new and improved Herwig++ tune. arXiv:1404.5630 [hep-ph] • New PYTHIA 8 Monash Tune: P. Skands, S. Carrazza, and J. Rojo have used the CDF UE data at 300 GeV, 900 GeV, and 1.96 TeV together with LHC data at 7 TeV to construct a new PYTHIA 8 tune (NNPDF2.3LO PDF). CMS-PAS-GEN-14-001 • New CMS UE Tunes: CMS has used the CDF UE data at 300 GeV, 900 GeV, and 1.96 TeV together wth CMS UE data at 7 TeV to construct a new PYTHIA 6 tune (CTEQ6L) and two new PYTHIA 8 tunes (CTEQ6L and HERAPDF1.5LO PDF). Rick Field – Florida/CDF/CMS
“transMAX” NchgDen vs Ecm • Corrected CMS data at 7 TeV and CDF data at 1.96 TeV, 900 GeV, and 300 GeV on the charged particle density in the “transMAX” region as defined by the leading charged particle (PTmax) for charged particles with pT > 0.5 GeV/c and |h| < 0.8. The data are corrected to the particle level with errors that include both the statistical error and the systematic uncertainty. • Corrected CMS and CDF data on the charged particle density in the “transMAX” region as defined by the leading charged particle (PTmax) for charged particles with pT > 0.5 GeV/c and |h| < 0.8 with 5 < PTmax < 6 GeV/c. The data are plotted versus the center-of-mass energy (log scale). Rick Field – Florida/CDF/CMS
“Transverse” NchgDen vs Ecm <transMIN> = 4.7 <transMAX> = 2.7 • Corrected CMS data at 7 TeV and CDF data at 1.96 TeV, 900 GeV, and 300 GeV on the charged particle density in the “transMAX” and “transMIN” regions as defined by the leading charged particle (PTmax) for charged particles with pT > 0.5 GeV/c and |h| < 0.8 with 5 < PTmax < 6 GeV/c. The data are plotted versus the center-of-mass energy (log scale). • Ratio of CMS data at 7 TeV and CDF data at 1.96 TeV, 900 GeV, and 300 GeVto the value at 300 GeV for the charged particle density in the “transMAX” and “transMIN” regions as defined by the leading charged particle (PTmax) for charged particles with pT > 0.5 GeV/c and |h| < 0.8 with 5 < PTmax < 6 GeV/c. The data are plotted versus the center-of-mass energy (log scale). The data are compared with PYTHIA 6.4 Tune Z1 and Tune Z2*. Rick Field – Florida/CDF/CMS
“TransMIN/DIF” vs Ecm The “transMIN” (MPI-BBR component) increases much faster with center-of-mass energy than the “transDIF” (ISR-FSR component)! Duh!! <transMIN> = 5.7 <transMIN> = 4.7 <transDIF> = 2.2 <transDIF> = 2.6 • Ratio of CMS data at 7 TeV and CDF data at 1.96 TeV, 900 GeV, and 300 GeVto the value at 300 GeV for the charged particle density in the “transMIN”, and “transDIF” regions as defined by the leading charged particle (PTmax) for charged particles with pT > 0.5 GeV/c and |h| < 0.8 with 5 < PTmax < 6 GeV/c. The data are plotted versus the center-of-mass energy (log scale). • Ratio of CMS data at 7 TeV and CDF data at 1.96 TeV, 900 GeV, and 300 GeVto the value at 300 GeV for the charged PTsum density in the “transMIN”, and “transDIF” regions as defined by the leading charged particle (PTmax) for charged particles with pT > 0.5 GeV/c and |h| < 0.8 with 5 < PTmax < 6 GeV/c. The data are plotted versus the center-of-mass energy (log scale). The data are compared with PYTHIA 6.4 Tune Z1 and Tune Z2*. Rick Field – Florida/CDF/CMS
“Tevatron” to the LHC CMS • Shows the “transAVE” charged PTsum density as defined by the leading charged particle, PTmax, as a function of PTmax at 300 GeV, 900 GeV, 1.96 TeV, and 7 TeV compared with the Skands Monash PYTHIA 8 tune. CDF CDF CDF • Shows the “transAVE” charged particle density as defined by the leading charged particle, PTmax, as a function of PTmax at 300 GeV, 900 GeV, 1.96 TeV, and 7 TeV compared with the Skands Monash PYTHIA 8 tune. Rick Field – Florida/CDF/CMS
“Tevatron” to the LHC • Shows the “transAVE” charged particle density as defined by the leading charged particle, PTmax, as a function of PTmax at 300 GeV, 900 GeV, 1.96 TeV, and 7 TeV compared with the CMS PYTHIA 8 tune CUETP8S1-CTEQ6L. • Shows the “transAVE” charged PTsum density as defined by the leading charged particle, PTmax, as a function of PTmax at 300 GeV, 900 GeV, 1.96 TeV, and 7 TeV compared with the CMS PYTHIA 8 tune CUETP8S1-CTEQ6L. Rick Field – Florida/CDF/CMS
Findings & Surprises What we are learning should allow for a deeper understanding of MPI which will result in more precise predictions at the future LHC energies of 13 & 14 TeV! • The “transverse” density increases faster with center-of-mass energy than the overall density (Nchg ≥ 1)! However, the “transverse” = “transAVE” region is not a true measure of the energy dependence of MPI since it receives large contributions from ISR and FSR. • The “transMIN” (MPI-BBR component) increases much faster with center-of-mass energy than the “transDIF” (ISR-FSR component)! Previously we only knew the energy dependence of “transAVE”. We now have at lot of MB & UE data at 300 GeV, 900 GeV, 1.96 TeV, and 7 TeV! We can study the energy dependence more precisely than ever before! Rick Field – Florida/CDF/CMS
DPS and the “Underlying Event” Having determined the parameters of an MPI model, one can make an unambiguous prediction of seff. In PYTHIA 8 seff depends primarily on the matter overlap function, which for bProfile = 3 is determined by the exponential shape parameter, expPow, and the MPI cross section determined by pT0 and the PDF. Multiple parton interactions (MPI)! 1/(pT)4→ 1/(pT2+pT02)2 “Underlying Event” “Underlying Event” DPS: Double Parton Scattering Most of the time MPI are much “softer” than the primary “hard” scattering, however, occasionally two “hard” 2-to-2 parton scatterings can occur within the same hadron-hadron. This is referred to as double parton scattering (DPS) and is typically described in terms of an effective cross section parameter, seff, defined as follows: Independent of A and B where sA and sB are the inclusive cross sections for individual hard scatterings of type A and B, respectively, and sAB is the inclusive cross section for producing both scatterings in the same hadron-hardon collision. If A and B are indistinguishable, as in 4-jet production, a statistical factor of ½ must be inserted. Rick Field – Florida/CDF/CMS
DPS Observables • Direct measurements of seff are performed by studying correlations between the outgoing objects in hadron-hadron collision. Two correlation observables that are sensitive to DPS are DS and DrelpT defined as follows: For g+3jets object#1 is the photon and the leading jet (jet1) and object#2 is jet2 and jet3. For W+dijet production object#1 is the W-boson and object#2 dijet. For 4-jet production object#1 is hard-jet pair and object#2 is the soft-jet pair. For DrelpT in W+dijet production jet#1 and jet#2 are the two dijets, while in 4-jet production jet#1 and jet#2 are the softer two jets. Rick Field – Florida/CDF/CMS
New since LHCP2013 DPS in g + 3 Jets and g +b/c + 2 Jets g + b/c + 2 Jets g + 3 Jets • Combine single parton scattering (SP) and double parton scattering (DP) and determine rhe fraction of DP necessary to fit the shape of the DS distribution. 8.7 fb-1 Phys. Rev. D 89, 072006 (2014) g + b/c + 2 Jets g + 3 Jets seff = 14.6 ± 0.6 (stat) ± 3.2 (syst) mb seff = 12.7 ± 0.2 (stat) ± 1.3 (syst) mb Rick Field – Florida/CDF/CMS
20-30 mb Sigma-Effective • Shows the seff values calculated from the PYTHIA 8 Monash and CMS tune CUETP8S1-CTEQ6L. PYTHIA 8 predicts an energy dependence for seff! New D0 values The seff predicted from the PYTHIA 8 UE tunes is slightly larger than the direct measurements! Rick Field – Florida/CDF/CMS
~9 orders of magnitude Higgs ED Summay: Tevatron Physics • The CDF & D0 continue to produce important precise QCD and electroweak measurements! PRODUCTION CROSS SECTION (fb) W’, Z’, T’ Rick Field – Florida/CDF/CMS
PYTHIA Monash CMS HERWIG++ 6 8 CUETP8S1 Summary: QCD MC Tunes We will be ready for the future LHC energies of 13 & 14 TeV! We now have at lot of MB & UE data at 300 GeV, 900 GeV, 1.96 TeV, and 7 TeV! We can study the energy dependence more precisely than ever before! • Several new and improved QCD MC tunes have already been constructed using data from the “Tevatron Energy Scan” and more will be coming soon! Rick Field – Florida/CDF/CMS