Download
1 / 26
260 likes | 368 Vues
This overview explores the significant influence of anthropogenic activities on the nitrogen cycle, particularly through fossil fuel emissions and fertilizer usage. Between 1990 and 2006, nitrogen fixation rates nearly doubled due to human activities, leading to an increase in nitrous oxide and nitrogen oxides in the atmosphere. Key processes such as biological nitrogen fixation, denitrification, and the effects of acid deposition on ecosystems are discussed. The study underscores the need for intervention to mitigate nitrogen overloading and protect environmental health.

E N D
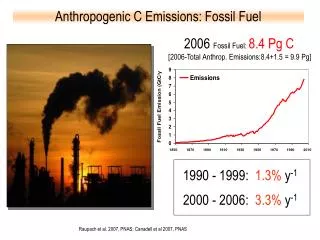
1850 1870 1890 1910 1930 1950 1970 1990 2010 Anthropogenic C Emissions: Fossil Fuel 2006 Fossil Fuel: 8.4 Pg C [2006-Total Anthrop. Emissions:8.4+1.5 = 9.9 Pg] • 1990 - 1999: 1.3% y-1 • 2000 - 2006: 3.3% y-1 Raupach et al. 2007, PNAS; Canadell et al 2007, PNAS
Nitrogen Cycle Units=teragrams yr-1
Nitrogen Cycle Largest pool of nitrogen=atmospheric N2 vegetation = 4,000 Tg soils = 100,000 Tg atmosphere = 3,900,000,000 Tg Biological N fixation has historically been the major input of N into ecosystems Oceans = 100 Tg/yr Land = 140 Tg/yr Denitrification is major output of N back to the atmosphere Oceans = 110 Tg/yr Land = 200 Tg/yr Balance?
Nitrogen Cycle N is most commonly limiting element in terrestrial ecosystems, and in some aquatic ecosystems (estuaries, coastal seas) Amount that cycles within terrestrial ecosystems is 9 times the land N fixation rate Amount that cycles within ocean ecosystems is 80 times the ocean N fixation rate
Changing Nitrogen Cycle Humans have doubled the N fixation rates over natural levels Haber-Bosch 3CH4 + 6H2O --> 3CO2 + 12H2 4N2+12H2 --> 8NH3 (high T,pressure, Fe) Bread AND Bombs
Changing Nitrogen Cycle About half of human additions come from fertilizer production About a quarter from increasing amount of biological N fixation The other quarter inadvertently from fossil fuel combustion
Changing Nitrogen Cycle Increased fertilizer inputs can: volatilize from fields, pastures (NH3) increase nitrification (NO, N2O,NO3- leaching) increased denitrification (NO, N2O, N2)
Other Changes in the Nitrogen Cycle • Mobilization of N from long term storage • incomplete fossil fuel combustion releases NOx • biomass burning releases NH3, NOx • land clearing, conversion, drainage, or permafrost thaw can increase leaks in the N cycle
GWP=200 Changing N Cycle: Effects on Atmosphere N2O (nitrous oxide) N2O (Nitrous oxide) Reacts with excited O in stratosphere to form NO and catalyze destruction of O3 IPCC 2007
Changing N Cycle: Effects on Atmosphere NOx (Nitric oxides) high concentrations contribute to O3 formation in troposphere stratospheric ozone = good (but, ozone hole = bad) tropospheric ozone = bad (smog, greenhouse gas)
Trophospheric ozone formation and destruction Net reaction at high [NOx]: CO + 2O2 + hv --> CO2 + O3 Net reaction at low [NOx]: CO + O3 + hv --> CO2 + O2
Trophospheric ozone OH + CO + O2 --> CO2 + HO2 HO2 + NO --> NO2 + OH NO2 + hv --> NO+ O O2 + O + M --> O3 + M net: CO + 2O2 + hv --> CO2 + O3
Changing N Cycle: Effects on Atmosphere NOx contributes to nitric acid formation in troposphere HO2 + NO --> NO2 + OH NO2 + H2O --> H+ + HNO3- N transfer to “downwind” terrestrial and aquatic ecosystems
Acid deposition and atmosphere pH • Wetfall: deposition of nutrients by precipitation (easy to • measure with exception of fog) • Acid rain = pH 5.6, bad for ecosystems! • NO3- HNO3 • SO42- H2SO4 • NH3 and Ca2+ important for neutralizing atm.’s acidity • Globally, 22% of acidity is neutralized by NH3 • Regionally: • Southern hemisphere: NH3 most important • NE US and Europe: SO42- drives acidity • Western US: acid ions interact with CaCO3
Dry deposition • Dryfall: gravitational sedimentation of particles without rain • NH4+, NO3- • Dust • NO2 and NH3 gases • Acid vapors • Controlled by wind and canopy structure • Hard to measure and poorly constrained
Effects of N Transfers on Ecosystems Nitrogen deposition downwind from NH3 and NOx sources unpolluted areas = 1 kg N/ha/yr Northeastern US = 10-20 kg N/ha/yr some parts of Europe = 50-100 kg N/ha/yr How much N is this?
NADP animations • http://nadp.sws.uiuc.edu/data/animaps.aspx
(1 g N m-2 yr-1 = 10 kg ha-1 yr-1) Galloway et al. 2008
Next Monday: Ecosystem-level effects of N deposition Fertilization Saturation Biogeochemical feedbacks
Fig. 1. N contained in internationally traded (A) fertilizer (31 Tg N), (B) grain (12 Tg N), and (C) meat (0.8 Tg N). J N Galloway et al. Science 2008;320:889-892 Published by AAAS
Fig. 3. Conceptual model of where interventions in the N cycle can be used to decrease the amount of Nr created or the amount of Nr lost to the environment. J N Galloway et al. Science 2008;320:889-892 Published by AAAS