Download

1 / 46
460 likes | 657 Vues
Can we have low unemployment and low inflation?. 15. The Short-Run Policy Tradeoff. CHAPTER CHECKLIST. When you have completed your study of this chapter, you will be able to. 1 Describe the short-run policy tradeoff between inflation and unemployment.

E N D
Can we have low unemployment • and low inflation?
15 The Short-Run Policy Tradeoff CHAPTER CHECKLIST When you have completed your study of this chapter, you will be able to • 1Describe the short-run policy tradeoff between inflation and unemployment. • 2 Distinguish between the short-run and long-run Phillips curves and describe the shifting tradeoff between inflation and unemployment. • 3 Explain how the Fed can influence the inflation rate and the unemployment rate.
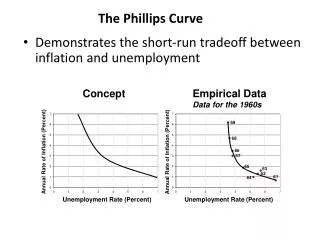
15.1 THE SHORT-RUN PHILLIPS CURVE • Short-run Phillips curveis a curve that shows the relationship between the inflation rate and the unemployment rate when the natural unemployment rate and the expected inflation rate remain constant. • Figure 15.1 on the next slide shows a short-run Phillips curve.
15.1 THE SHORT-RUN PHILLIPS CURVE 1. The natural unemployment rate is 6 percent. 2. The expected inflation rate is 3 percent a year. 3. This combination, at point B, provides the anchor point for the short-run Phillips curve.
15.1 THE SHORT-RUN PHILLIPS CURVE A lower unemployment rate brings a higher inflation rate, such as at point A. A higher unemployment rate brings a lower inflation rate, such as at point C. 4. The short-run Phillips curve passes through points A, B, and C and is the curve SRPC.
15.1 THE SHORT-RUN PHILLIPS CURVE • Aggregate Supply and the Short-Run Phillips Curve • The AS-AD model explains the negative relationship between unemployment and inflation along the short-run Phillips curve. • The short-run Phillips curve is another way of looking at the upward-sloping aggregate supply curve. • Both curves arise because the money wage rate is fixed in the short run.
15.1 THE SHORT-RUN PHILLIPS CURVE • Along the aggregate supply curve, the money wage rate is fixed. So when the price level rises, the real wage rate falls. • And the quantity of labor employed increases. • Along the short-run Phillips curve, the rise in the price level means an increase in inflation. • The increase in quantity of labor employed means a decrease in the number unemployed and a decrease in the unemployment rate.
15.1 THE SHORT-RUN PHILLIPS CURVE • So a movement along the AS curve is equivalent to a movement along the short-run Phillips curve. • Unemployment and Real GDP • At full employment, the quantity of real GDP is potential GDP and the unemployment rate is the natural unemployment rate. • If real GDP exceeds potential GDP, employment exceeds its full-employment level and the unemployment rate falls below the natural unemployment rate.
15.1 THE SHORT-RUN PHILLIPS CURVE • Similarly, if real GDP is less than potential GDP, employment is less than its full employment level and the unemployment rate rises above the natural unemployment rate. • Okun’s Law • For each percentage point that the unemployment rate is above the natural unemployment rate, there is a 2 percent gap between real GDP and potential GDP.
15.1 THE SHORT-RUN PHILLIPS CURVE • Inflation and the Price Level • The inflation rate is defined as the percentage change in the price level. • So starting from any given price level, the higher the inflation rate, the higher is the current period’s price level. • Figure 15.2 on the next slide shows the connection between the short-run Phillips Curve and the aggregate supply curve.
15.1 THE SHORT-RUN PHILLIPS CURVE At point A on the Phillips curve: The unemployment rate is 5 percent and the inflation rate is 4 percent a year. Point A on the Phillips curve corresponds to point A on the aggregate supply curve: Real GDP is $10.2 trillion and the price level is 104.
15.1 THE SHORT-RUN PHILLIPS CURVE At point B on the Phillips curve: The unemployment rate is 6 percent and the inflation rate is 3 percent a year. Point B on the Phillips curve corresponds to point B on the aggregate supply curve: Real GDP is $10 trillion and the price level is 103.
15.1 THE SHORT-RUN PHILLIPS CURVE At point C on the Phillips curve: The unemployment rate is 7 percent and the inflation rate is 2 percent a year. Point C on the Phillips curve corresponds to point C on the aggregate supply curve: Real GDP is $9.8 trillion and the price level is 102.
15.1 THE SHORT-RUN PHILLIPS CURVE • Aggregate Demand Fluctuations • Aggregate demand fluctuations bring movements along the aggregate supply curve and equivalent movements along the short-run Phillips curve.
15.1 THE SHORT-RUN PHILLIPS CURVE • Why Bother with the Phillips Curve? • First, the Phillips curve focuses directly on two policy targets: the inflation rate and the unemployment rate. • Second, the aggregate supply curve shifts whenever the money wage rate or potential GDP changes, but the short-run Phillips curve does not shift unless either the natural unemployment rate or the expected inflation rate change.
15.2 SHORT-RUN AND LONG-RUN PHILLIPS CURVES • The Long-Run Phillips Curve • The long-run Phillips curve is a vertical line that shows the relationship between inflation and unemployment when the economy is at full employment. • Figure 15.3 shows the long-run Phillips Curve.
15.2 SHORT-RUN AND LONG-RUN ... The long-run Phillips curve is a vertical line at the natural unemployment rate. In the long run, there is no unemployment-inflation tradeoff.
15.2 SHORT-RUN AND LONG-RUN PHILLIPS CURVES • No Long-Run Tradeoff • Because the long-run Phillips curve is vertical, there is no long-run tradeoff between unemployment and inflation. • In the long run, the only unemployment rate available is the natural unemployment rate, but any inflation rate can occur.
15.2 SHORT-RUN AND LONG-RUN PHILLIPS CURVES • Expected Inflation • The expected inflation rate is the inflation rate that people forecast and use to set the money wage rate and other money prices. • Because the actual inflation rate equals the expected inflation rate at full employment, we can interpret the long-run Phillips curve as the relationship between inflation and unemployment when the inflation rate equals the expected inflation rate.
15.2 SHORT-RUN AND LONG-RUN ... If the natural unemployment rate is 6 percent, the long-run Phillips curve is LRPC. 1. If the expected inflation rate is 3 percent a year, the short-run Phillips curve is SRPC0. 2. If the expected inflation rate is 7 percent a year, the short-run Phillips curve is SRPC1.
15.2 SHORT-RUN AND LONG-RUN PHILLIPS CURVES • The Natural Rate Hypothesis • The natural rate hypothesis is the proposition that when the inflation rate changes, the unemployment rate changes temporarily and eventually returns to the natural unemployment rate. • Figure 15.5 illustrates the natural rate hypothesis.
15.2 SHORT-RUN AND LONG-RUN ... The inflation rate is 3 percent a year and the economy is at full employment, at point A. Then the inflation rate increases. In the short run, the increase in inflation brings a decrease in the unemployment rate — a movement along SRPC0 to point B.
15.2 SHORT-RUN AND LONG-RUN PHILLIPS CURVES Eventually, the higher inflation rate is expected and the short-run Phillips curve shifts upward to SRPC1. At the higher expected inflation rate, unemployment returns to the natural unemployment rate—the natural rate hypothesis.
15.2 SHORT-RUN AND LONG-RUN PHILLIPS CURVES • Changes in the Natural Unemployment Rate • If the natural unemployment rate changes, both the long-run Phillips curve and the short-run Phillips curve shift. • When the natural unemployment rate increases, both the long-run Phillips curve and the short-run Phillips curve shift rightward. • When the natural unemployment rate decreases, both the long-run Phillips curve and the short-run Phillips curve shift leftward.
15.2 SHORT-RUN AND LONG-RUN ... Figure 15.6 shows the effect of changes in the natural unemployment rate. The expected inflation rate is 3 percent a year. The natural unemployment rate is 6 percent.
15.2 SHORT-RUN AND LONG-RUN PHILLIPS CURVES The short-run Phillips curve is SRPC0 and the long-run Phillips curve is LRPC0. A decrease in the natural unemployment rate shifts the two Phillips curves leftward to LRPC1 and SRPC1.
15.2 SHORT-RUN AND LONG-RUN PHILLIPS CURVES • Have Changes in the Natural Unemployment Rate Changed the Tradeoff? • Changes in the natural unemployment rate have changed the tradeoff. • According to the Congressional Budget Office, the natural unemployment rate increased from about 5 percent in 1950 to more than 6 percent in the mid-1970s. • It decreased to 4.8 percent by 2000 and has been constant at this level through 2009.
15.3 INFLUENCING INFLATION AND UNEMPLOYMENT • Influencing the Expected Inflation Rate • The expected inflation rate is the inflation rate that people forecast and use to set the money wage rate and other money prices. • Rational expectation is the forecast that results from the use of all the relevant data and economic science.
15.3 INFLUENCING INFLATION AND UNEMPLOYMENT • Targeting the Unemployment Rate • Suppose that the Fed wants to lower the unemployment rate. • The Fed speeds up the growth rate of aggregate demand by speeding up the growth rate of money and lowering the interest rate. • With a given expected inflation rate, the unemployment rate initially falls and the inflation rate rises slightly.
15.3 INFLUENCING INFLATION AND UNEMPLOYMENT • But if the Fed drives the unemployment rate below the natural rate, the inflation rate will continue to rise. • As the higher inflation rate becomes expected, wages and prices start to rise more rapidly. • If the Fed keeps increasing aggregate demand, the expected inflation rate rises. • Eventually, both inflation and unemployment will increase and the economy will return to full employment and the natural unemployment rate.
15.3 INFLUENCING INFLATION AND UNEMPLOYMENT Figure 15.7 illustrates the effects of the Fed’s policy. The economy starts at point A, with the unemployment rate higher than the natural unemployment rate on SRPC0. The Fed increases the growth rate of real GDP and the economy slides up along SRPC0.
15.3 INFLUENCING INFLATION AND UNEMPLOYMENT If the Fed continues to increase the growth rate of aggregate demand, the inflation rate rises and unemployment falls below the natural rate. With the inflation rate rising, the expected inflation rate gradually rises and both inflation and unemployment increase.
15.3 INFLUENCING INFLATION AND UNEMPLOYMENT • The economy gradually moves to point B. • With an expected inflation rate of 10 percent a year, the short-run Phillips curve has shifted up to SRPC1.
15.3 INFLUENCING INFLATION AND UNEMPLOYMENT • What Can the Fed Do to Lower Expected Inflation? • If the Fed wants to lower the inflation rate, it can pursue two alternative lines of attack: • A surprise inflation reduction • A credible announced inflation reduction • The figure on the next slide shows the effects of policy actions to lower the inflation rate.
15.3 INFLUENCING INFLATION AND UNEMPLOYMENT The economy is on the short-run Phillips curve SRPC0 and on the long-run Phillips curve LRPC. The natural unemployment rate is 6 percent, and inflation is 10 percent a year.
15.3 INFLUENCING INFLATION AND UNEMPLOYMENT A Surprise Inflation Reduction The Fed unexpectedly slows inflation to its target of 3 percent a year. The inflation rate falls and the unemployment rate increases as the economy slides down along SRPC0.
15.3 INFLUENCING INFLATION AND UNEMPLOYMENT Gradually, the expected inflation rate falls and the short run Phillips curve gradually shifts downward. The unemployment rate remains above at 6 percent through the adjustment to point B on SRPC1.
15.3 INFLUENCING INFLATION AND UNEMPLOYMENT A Credible Announced Inflation Reduction A credible announced plan to reduce the inflation rate lowers the expected inflation rate and shifts the short-run Phillips curve downward. Inflation rate falls and unemployment remains at 6 percent as the economy moves along LRPC.
15.3 INFLUENCING INFLATION AND UNEMPLOYMENT • This credible announced inflation reduction lowers the inflation rate but with no accompanying loss of output or increase in unemployment. • Inflation Reduction in Practice • In 1981, when we last faced a high inflation rate, the Fed slowed it, we paid a high price. • The Fed’s policy action was unexpected. • Money wage rates had been set too high for the path that the Fed followed.
Can We Have Low Unemployment andLow Inflation? The short-run Phillips curve describes the unemployment–inflation tradeoff that we face. In the short run, we can have low unemployment only if we permit the inflation rate to rise. And we can have low inflation only if we permit the unemployment rate to increase. But in the long run, we can improve that tradeoff. We can have low unemployment if we can lower the natural unemployment rate, but that is hard to do.
Can We Have Low Unemployment andLow Inflation? We can have low inflation if we can lower the expected inflation rate. That, too, is hard to do, but it isn’t as hard as lowering the natural unemployment rate. The expected inflation rate does change frequently and sometimes by large amounts. The years 2000–2010 show how changes in the expected inflation rate change the short-run tradeoff.
Can We Have Low Unemployment andLow Inflation? The blue dots show the unemployment rate and the inflation rate each year from 2000 to 2010. The red line shows how the relationship between inflation and unemployment changed.
Can We Have Low Unemployment andLow Inflation? During 2000–2010, the natural unemployment rate was constant at 5 percent, so the long-run Phillips curve remained fixed at LRPC. The expected inflation rate was 2.5 percent a year in 2000 and 2001 and the short-run Phillips curve was SRPC0.
Can We Have Low Unemployment andLow Inflation? The expected inflation rate rose to 3.5 percent a year and remained there until 2005. The short-run Phillips curve shifted to SRPC1. In 2006, the expected inflation rate fell to 2.5 percent a year and the short-run Phillips curve shifted back to SRPC0.
Can We Have Low Unemployment andLow Inflation? In 2008 and 2010, both inflation and unemployment increased, … probably because there was a temporary spike in the natural unemployment rate and the expected inflation rate increased.