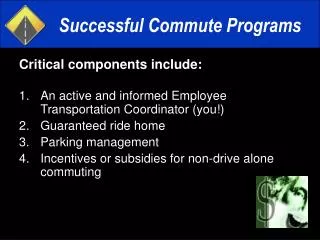
Estimating Commute Trips
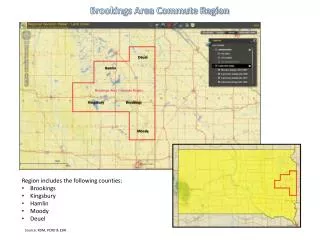
This study, initiated by Evergreen State College's Parking Office and supported by the Office of Institutional Research, explored student and employee commuting patterns to inform the Commute Trip Reduction Program. By geocoding addresses from student and employee data collected in Fall 2004 and Spring 2005, respectively, the analysis revealed that a significant percentage of students live within 1 mile of the Olympia campus, while most employees are located 3 to 5 miles away. The findings also spurred additional research opportunities through detailed mapping and demographic analyses.

Estimating Commute Trips
E N D
Presentation Transcript
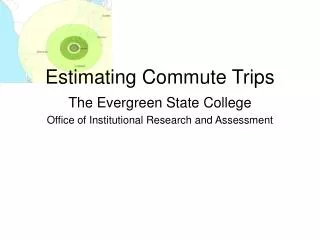
Estimating Commute Trips The Evergreen State College Office of Institutional Research and Assessment
Reason for study • Parking Office wanted information on student and employee commuting patterns as part of the Commute Trip Reduction Program. • Institutional Research wanted to support the effort and experiment with geocoding addresses for other research.
Methodology • Geocoding - addresses were mapped as points relative to a reference file (Census Tiger files) • Student mailing addresses from Fall 2004 snapshot were used. • If addresses were out-of-state, PO Boxes, billing, and/or parent addresses then attempts were made to identify other address. • Employee addresses from Spring 2005 were used. PO Boxes were excluded. • The records from Commute Trip Survey reviewed to confirm addresses or provide more accurate commuting addresses. • Total of 92% of student and employee addresses were geocoded.
Students’ Commute Distances Compared to Employees’“The Donut Analysis”
Observations • Greatest percentages of students live within 1 mile of Olympia campus (27%, N=1,019) • Greatest percentage of employees between 3 to 5 miles of Olympia campus (28%, N=221) • 39% of students live within 3 miles of the Olympia campus compared to 23% of employees. • The greater percentage of student addresses outside of 60 miles (4%) may reflect both students independent learning opportunities and some out-of-date addresses.
Other ways to view the data… • Instead of addresses as points or rings showing distance choropleth maps can be used. • The map on the next page was normalized, the map shows concentrations of students and employees per 100 people in each census tract. This controls for differences in the population of each census tract.
Lessons Learned • Geocoding is time consuming and requires close auditing of geocoded addresses, doing some matches by hand, and making edits to the reference file. • These maps are estimates; mailing addresses are a best guess as to where people are commuting from.
Other Analyses • Part-time and full-time attributes in the database, so that differences in commute patterns could be analyzed. • With a complete bus route map, an analysis of the number of students and employees that live within walking distance to a bus stop. • Find concentrations to suggest neighborhood carpools or other alternatives.
Other Institutional Research Maps • Student County of Origin • Student State of Origin • Transfer Institutions www.evergreen.edu/institutionalresearch