1. Financial markets functioning better Basis spread, basis points
80 likes | 314 Vues
1. Financial markets functioning better Basis spread, basis points. Sources : Reuters EcoWin and the Riksbank. Note. The difference between 3-month interbank rate and expected policy rate (basis-spread). 2.World trade stabilising World trade monitor index, 2000 = 100, seasonally-adjusted data.

1. Financial markets functioning better Basis spread, basis points
E N D
Presentation Transcript
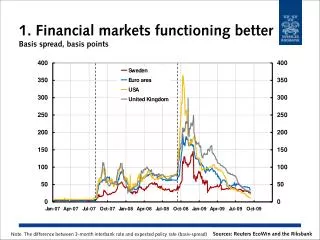
1. Financial markets functioning betterBasis spread, basis points Sources: Reuters EcoWin and the Riksbank Note. The difference between 3-month interbank rate and expected policy rate (basis-spread)
2.World trade stabilisingWorld trade monitor index, 2000 = 100, seasonally-adjusted data Source: Netherlands Bureau for Economic Policy Analysis
3.Growth in AsiaGDP, annual percentage change Sources: National sources
4.House prices in the USAIndex, January 2000 = 100, seasonally-adjusted data Source: Standard & Poor's
5.Growth increasing in the world GDP, quarterly change in per cent calculated as an annual rate, seasonally-adjusted data Sources: National sources and the Riksbank
6.GDPQuarterly changes in per cent calculated in annualised terms, seasonally-adjusted data Sources: Statistics Sweden and the Riksbank Note. Broken lines refer to the Riksbank’s forecasts.
7.High unemployment throughout the forecast periodUnemployment, per cent of labour force, seasonally-adjusted data Sources: Statistics Sweden and the Riksbank Note. Broken lines represent the Riksbank’s forecast, 15-74 age group.
8. CPI and CPIFAnnual percentage change Note. Broken lines represent the Riksbank’s forecast. Sources: Statistics Sweden and the Riksbank