Download

1 / 19
190 likes | 364 Vues
Assessment of sequence alignment. Lecture 10. Introduction. The Dot plot Matrix visualisation matching tool: Basics of Dot plot Examples of Dot plot matching sequences Tandems repeats self matching Inverted repeats: genetic palindromes. Sequence alignment Analysis.

E N D
Assessment of sequence alignment Lecture 10
Introduction • The Dot plot Matrix visualisation matching tool: • Basics of Dot plot • Examples of Dot plot matching sequences • Tandems repeats self matching • Inverted repeats: genetic palindromes
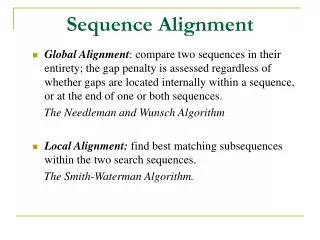
Sequence alignment Analysis • In order to measure the degree of similarity between sequences they must first be aligned to maximise the matching score (refer to lecture 11): • Example 1 • I am from Cork • I am not from Cork • **** • (4 matches out of 18; based on length of bottom string) • Example 2 • I am ---- from Cork • I am not from Cork • **** ********** • (14 matches out of 18; based on length of bottom string)
The Dot plot • A “better” way of doing this is to represent each sequence as a table or matrix, where one sequence represents the rows and the other the columns. The Dot plot Matrix is a visual way of seeing the alignment between two sequences: • The first sequence (query sequence) represents the rows and the other sequence (subject sequence) represents the columns. • All elements (row/column) are checked for a match and if there the cell is marked. • This will show all areas of both sequences where matches occur.
Dot plot • Consider the following: • Diagonal lines represent a alignments (match) • Horizontal lines between aligned sequences indicate gaps are required (where the gaps indicate a deletion/insertion) • This has four “potential” aligned sequences: • D->Y; • H->N • R->0 • 0->H • Longest sequence of alignments are: • “THIS” ; and “SEQUENCE“; • “IS” would be considered as gaps • The pink dots: they can represent noise (spurious alignments) adapted from understanding bioinformatics p. 77
Dot plot Matrix: purpose • This allows us to visualise areas of “local alignment” as opposed to global alignment. • One of the main purpose to find domains / motifs that match . This could be useful for many reasons; e.g. promoter factor binding site, finding exons…. • For visualisation of pair-wise alignment you have one query on the x-axis and the other on the y-axis.
Dot Plot noise This shows the effect of noise (blue line has be been inserted to highlight alignment if interest. The figure on the left represents SH2 sequence (sample files ) plotted against inself. The one on the right has been filter; in this case an alignment must be at least 10 residues long with a score of 3. adapted from understanding bioinformatics p. 77
Dot plot Matrix: imperfect match • Some alignments require gaps to increase the matching score; the gaps are used represent inclusion/deletion mutations • The diagram shows that most of the 2 sequences are aligned. Where there are gaps indicates areas of non-alignment or mismatches: gaps or substitutions Adapted from: dotplot example
Refer to saved web page Dot plot: example 1
Dot plot for Tandem Repeats • The human genome has many tandem repeats small sequences of nucleic acids (bases)/ Amino acids that are repeated and are ubiquitous in genomes and can compromise 50% of genome. (Richard 2008) • They can be used as genealogical markers • To determine specific regions of interest; e.g. introns • Play a significant part in evolution Gemayel 2010 • An example of a protein with multiple repeats is human mucin (Baxevanis 2005 p. 297)
Tandem repeat dot plot • To determine if there is tandem repeats the sequence is compared with itself (refer table 1) • The more diagonals the more repeats • The diagonals at the bottom left compare the start with the finish • The fact the main diagonal means the both sequences are the same . • The lines are symmetrical around the main diagonal:
Tandem repeats (Example) • BRCA2 gene has a number of BRC repeats (39 residues long. The diagram shows two plots: one with noise (unfiltered) and the other showing two repeating sequences. Adapted from Figure 4.3 understanding bioinformatics
Genetic “Palindromes” • A palindrome is a word that is spelt the same from right to left as well as from left to write: This will give an “X” shaped dot-plot. (try; eye, navan; never odd or even …..) • Remember left to right is (5’ to 3’) on primary strand and right to left is (5’ to 3’) on the complimentary strand. Alternatively it means a match between a strand and its reverse compliment. • 2 possible types of “Genetic Palindromes” [the difference being that the left to right, read, is on one strand while the right to left, read, is on its complimentary strand]: • Restrictive enzymes such as EcoR1: • 5’ GAATTC 3’ • 3’ CTTAAG 5’ • Inverted repeats • On different segments; each repeat read the same (GTGAG) but in opposite directions. An example is promoter region for the CAP protein in the lac operon : • 5‘ GTGAGnnnCTCAC 3'3' CACTCnnnGAGTG 5’ • What will the dot plot for the above 2 sequences look like.
Supplementary reading • The following provides links to further reading on DOT PLOTS. • introduction to dotplot (figure 6 gives a more indepth view of different types of plots referred to above: alignment, alignment with gaps, tandem repeats, palindromes….. • Inverted repeats and dotplot. (more advanced analysis of plots for inverted repeats)
Exam Question • Describe, using a suitable example, how to construct a dot plot matrix for the alignment of DNA/AA sequences. (10 marks) • Describe the significance of two types of repeating sequences found in DNA sequences (6 marks) • Explain, using suitable examples, how the DOT plot matrix can find the two types of repeating regions [what is plotted against what and what will the DOT PLOT look like] (14 marks)
References • Baxevanis A.D. 2005 Bioinformatics: a practical guide to the analysis of genes and proteins chapter 11; Wiley • Klug, W. S. (2010); the essentials of genetics; 7th ed Pearson Education • Gemayel, R. et al 2010 Variable tandem repeats accelerate evolution of coding and regulatory sequences. Annu Rev genet 44: 445-477 • Richard, G.F. (2008) Comparative genomics and molecular dynamics of DNA repeats in eukaryotes. Microbiol Mol biol rev 2008 Dec;72(4):686-727