Download

1 / 8
90 likes | 172 Vues
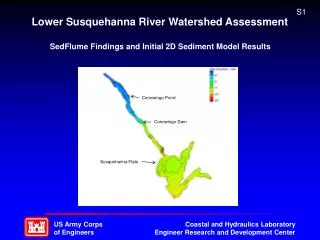
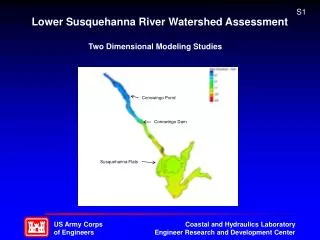
Effects of N Loadings from Dairy Cows to the Susquehanna River. Austin Weidner CE394K : GIS in Water Resources University of Texas at Austin November 19, 2013. Susquehanna River. River Length = 444 miles Basin Area = 27,510 mi 2 Covers 3 states (PA, NY, MD)

E N D
Effects of N Loadings from Dairy Cows to the Susquehanna River Austin Weidner CE394K : GIS in Water Resources University of Texas at Austin November 19, 2013
Susquehanna River • River Length = 444 miles • Basin Area = 27,510 mi2 • Covers 3 states (PA, NY, MD) • 67 counties • Average Flow = 40,174 ft3/s
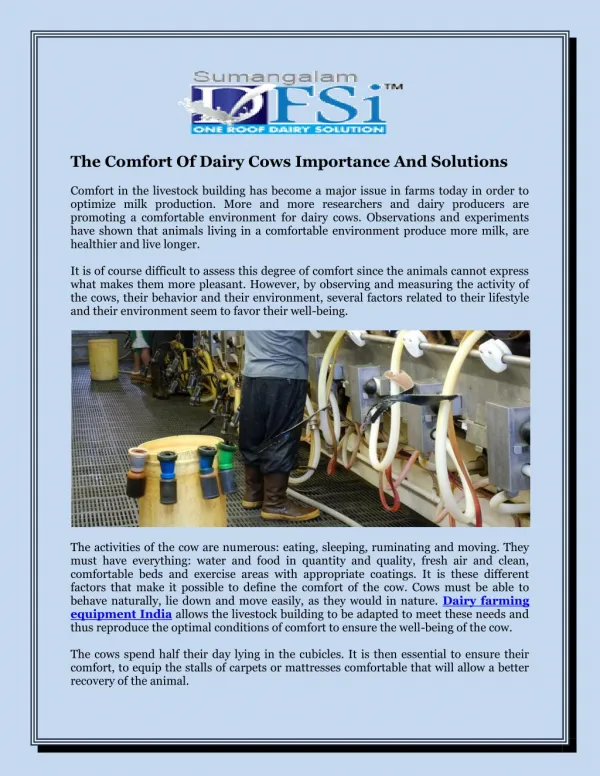
Impacts on Chesapeake Bay • Non-point pollution leads to dead zones • Agricultural Runoff • Susquehanna River provides • 40% of N Loading • 50% of which is manure Photo: Chesapeake Bay Foundation, 2013 Photo: Chesapeake Bay Foundation.Waters at Risk, 2006
2007 Dairy Cow Population • USDA Ag Census • Lacks Spatial Detail • Lancaster County, PA
2007 Dairy Cow Population • Spatial Estimation Used • Dairy Cows produce 121 kg N / year in Manure (Boyer, et al. 2002) 119.4 tons N/year
Future Work • Water Quality • Compare N estimates to actual stream measurements • Determine at risk streams • Precipitation impacts on runoff rates • Compare yearly precipitation / # of large storm events to N loadings • Precipitation varies spatially Discharge Stream Gauge: Susquehanna River at Conowingo, MD; Site ID 01578310
Conclusions • Susquehanna River is a major source of non-point source pollution to the Chesapeake Bay • Difficult to Analyze Non-Point Pollution in ArcGIS • Much of the Nutrient Loading comes from Dairy Cattle • An estimated 447,865 dairy cows live within the Susquehanna Basin producing 120 tons N / year • Future Work to analyze water quality data of subbasins and precipitation impacts