Download
1 / 13
130 likes | 221 Vues
Access state-level 12-13 EOY mCLASS reports paired with blank templates for comparing Reading 3D data to state outcomes in North Carolina. Utilize the templates to analyze and track your school or district's performance. For detailed instructions and support, contact infonc@wgen.net.

E N D
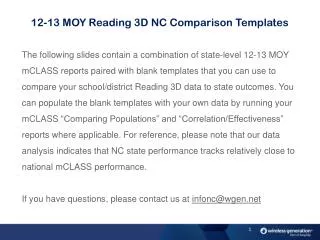
12-13 EOY Reading 3D NC Comparison Templates The following slides contain a combination of state-level 12-13 EOYmCLASS reports paired with blank templates that you can use to compare your school/district Reading 3D data to state outcomes. You can populate the blank templates with your own data by running your mCLASS “Comparing Populations” and “Correlation/Effectiveness” reports where applicable. For reference, please note that our data analysis indicates that NC state performance tracks relatively close to national mCLASS performance. If you have questions, please contact us at infonc@wgen.net
DIBELS Next Benchmark Comparison (BOY-EOY 12-13) The above DIBELS RAS Comparing Populations report reflects outcomes for all NC K-3 students assessed with Reading 3D at all benchmarks in SY 12-13. To populate the chart in Slide #3, run this same report for your school and/or district and enter the corresponding EOY percentages.
DIBELS Next Benchmark Comparison (EOY 12-13)* • * “State” percentages reflect all NC K-3 students assessed with mCLASS:Reading 3D at EOY 12-13
DIBELS Next Growth Comparison (BOY>EOY 12-13) The above DIBELS RAS Correlation/Effectiveness report reflects growth outcomes for all NC K-3 students assessed with Reading 3D at BOY and EOY 12-13. To populate the chart in Slides 5-7, run this same report for your school and/or district and enter the corresponding percentages.
DIBELS Next Growth Comparison (BOY>EOY 12-13)BOY Intensive Students
DIBELS Next Growth Comparison (BOY>EOY 12-13)BOY Strategic Students
DIBELS Next Growth Comparison (BOY>EOY 12-13)BOY Benchmark Students
TRC Benchmark Comparison (EOY 12-13) The above TRC RAS Comparing Populations report reflects outcomes for all NC K-3 students assessed with Reading 3D at EOY 12-13. To populate the chart in Slide 9, run this same report for your school and/or district and enter the corresponding percentages.
TRC Growth Comparison (BOY>EOY 12-13) The above TRC RAS Correlation/Effectiveness report reflects growth outcomes for all NC K-3 students assessed with Reading 3D at BOY and EOY 12-13. To populate the chart in Slides 11-13, run this same report for your school and/or district and enter the corresponding percentages.
TRC Growth Comparison (BOY>EOY 12-13)BOY Students Far Below Proficient
TRC Growth Comparison (BOY>EOY 12-13)BOY Students Below Proficient
TRC Growth Comparison (BOY>EOY 12-13);BOY Students Proficient and Above