County Taxpayer Returns Analysis (2000-2011): Income, Employment, and Revenue Trends
This report analyzes taxpayer returns by county from 2000 to 2011, including adjustments for gross income, average wages, and salaries. It provides a detailed examination of unemployment trends and the labor force dynamics, highlighting the change in unemployment percentages and fiscal sales tax collections over the years. The budget history from 2002 to 2011 reflects major revenue sources and expenditures, along with property tax revenue distribution by fund. Key findings include the impact of economic shifts on funding and public services.

County Taxpayer Returns Analysis (2000-2011): Income, Employment, and Revenue Trends
E N D
Presentation Transcript
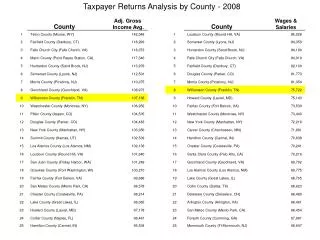
Taxpayer Returns Analysis by County - 2008 Adj. Gross Income Avg. Wages & Salaries County County
Labor Force Employment and Unemployment Data Unemployment Percentage
2002 210,509,481 125,802,000 59.76% 84,707,481 40.24% 2011 362,914,734 233,560,823 64.36% 129,353,911 35.64%
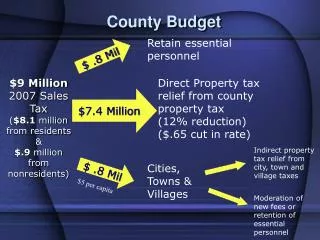
FY 2011 Major Revenue Sources Total for All Funds
Property Tax Pennies replaced with Adequate Facilities Taxes 23.5 19.0 16.7 10.5 8.6 8.5 8.0 8.0 2.5 1.9 1.9
Annual Principal and Interest PaymentsExcluding Self-Supporting Hospital and County/City Partnerships(As of June 30, 2011) $Millions