Antibiotic-Induced Fold Changes in B. subtilis Target Genes Comparison Study
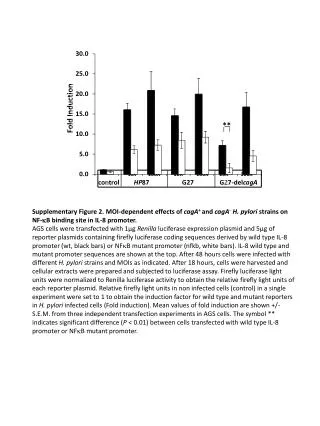
Graphical comparison of daptomycin and friulimicin effects on LiaRS and ECF target genes fold changes in B. subtilis. Proteins' expression profiles and killing curves shown. Induction of the liaI promoter analyzed.

Antibiotic-Induced Fold Changes in B. subtilis Target Genes Comparison Study
E N D
Presentation Transcript
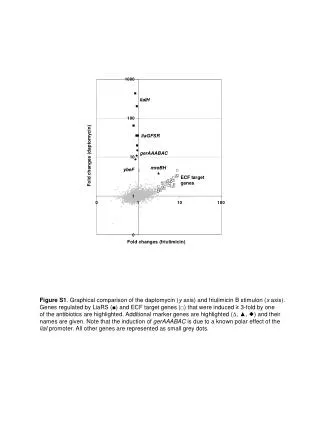
liaIH liaGFSR gerAAABAC Fold changes (daptomycin) mreBH ybeF ECF target genes Fold changes (friulimicin) Figure S1. Graphical comparison of the daptomycin (y axis) and friulimicin B stimulon (x axis). Genes regulated by LiaRS (■) and ECF target genes (□) that were induced ≥ 3-fold by one of the antibiotics are highlighted. Additional marker genes are highlighted (∆, ▲, ) and their names are given. Note that the induction of gerAAABAC is due to a known polar effect of the liaI promoter. All other genes are represented as small grey dots.
Friulimicin (10 min) Daptomycin (10 min) Friulimicin Daptomycin Friulimicin (30 min) Daptomycin (30 min) Figure S2. Protein expression profiles of B. subtilis 168 before (green image) and after 10 or 30 min of the exposure (red image) to FRI (left) and DAP (right), respectively.
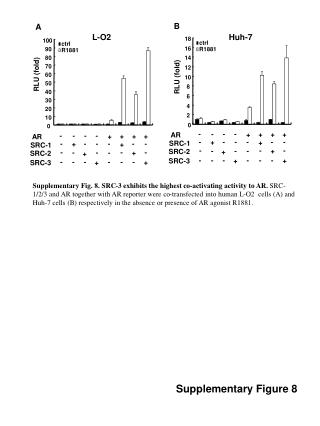
C Miller Units µg/ml A OD600 h B OD600 h Figure S3. Killing curves and concentration-dependent induction of the liaI promoter in B. subtilis cultures treated with daptomycin and friulimicin B. (A) Killing curves daptomycin. LB medium was inoculated from a fresh overnight culture of B. subtilis W168 and incubated at 37°C with aeration. Cell density was monitored by measuring OD600 at regular intervals. At mid-logarithmic growth phase (OD600 ~ 0.5) the culture was split and induced with different concentrations of daptomycin (■, uninduced control; □, 0.5 µg/ml; , 1 µg/ml; , 2 µg/ml; , 5 µg/ml; 10 µg/ml; , 50 µg/ml). (B) Friulimicin killing curves, using the same experimental conditions as above. (C) Induction of the liaI promoter. Strain BFS2470 was grown in LB medium as described above and induced with different concentrations of daptomycin (grey bars) and friulimicin (striped bars), respectively, for 30 min, with one sample remaining as the uninduced control. The cells were harvested and β-galactosidase assays were performed as described in Material and Methods. The PliaI activity, expressed in Miller Units (Miller, 1972), is shown on the y-axis.