Download
1 / 6
60 likes | 147 Vues
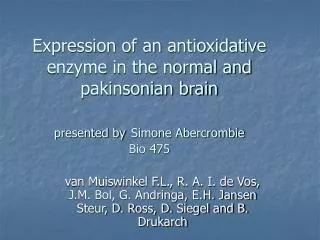
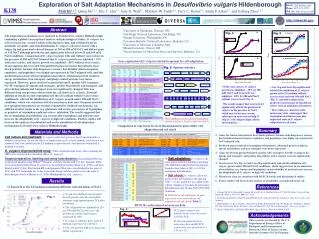
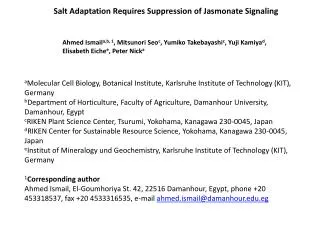
This study explores the suppression of Jasmonate signaling as a mechanism for salt adaptation in Vitis species. The research conducted at institutions in Germany, Egypt, and Japan indicates that under salt stress conditions, there are significant changes in the levels of endogenous phytohormones, such as JA, JA-Il, ABA, IAA, and SA. The data presented in the figures show the impact of different treatments on the concentrations of IAA and SA at various time points. The findings suggest that suppressing Jasmonate signaling plays a crucial role in the adaptation of Vitis species to high salinity environments.

E N D
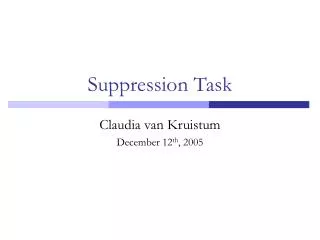
Salt Adaptation Requires Suppression of Jasmonate Signaling Ahmed Ismaila,b, 1, Mitsunori Seoc,Yumiko Takebayashic, Yuji Kamiyad, Elisabeth Eichee, Peter Nicka aMolecular Cell Biology, Botanical Institute, Karlsruhe Institute of Technology (KIT), Germany bDepartment of Horticulture, Faculty of Agriculture, Damanhour University, Damanhour, Egypt cRIKEN Plant Science Center, Tsurumi, Yokohama, Kanagawa 230-0045, Japan dRIKEN Center for Sustainable Resource Science, Yokohama, Kanagawa 230-0045, Japan eInstitut of Mineralogy und Geochemistry, Karlsruhe Institute of Technology (KIT), Germany 1Corresponding author Ahmed Ismail, El-Goumhoriya St. 42, 22516 Damanhour, Egypt, phone +20 453318537, fax +20 4533316535, e-mail ahmed.ismail@damanhour.edu.eg
V. rupestris V. riparia Supp. Fig. 1. Cell morphology of V. rupestris or V. riparia under control conditions. Size bar 50µm.
A B C Supp. Figure 2A, B, C
E D Supp. Figure 2 D, E Supp. Fig. 2: Endogenous phytohormones under salinity treatment at different time points in V. rupestris or V. riparia supernatant. The effect of 155 mM NaCl at 1, 3, 6h on JA (A), JA-Il (B), ABA (C), IAA (D), and SA (E). Control samples were treated by H2O for 1h. Error bars represent SE, and different letters indicate significant differences among treatments (LSD (P<.05)). Supernatant dry weight (SDW).
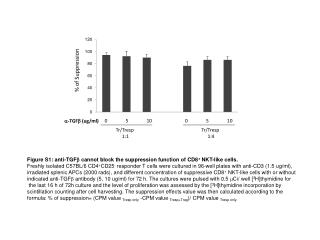
A B c b b b cd b b b d b b ab cd b a a Supp. Fig. 3: Endogenous concentrations of IAA (A) and SA (B) under 155 mM NaCl at 1, 3, 6h in V. rupestris or V. riparia cells. Control samples were treated by H2O for 1h. Error bars represent SE, and different letters indicate significant differences among treatments (LSD (P<.05)).
c e B A d bc e c ab c c e abc c e bc abc b e c a abc c e a abc e c c a Supp. Fig. 4: Endogenous IAA (A) and SA (B) under different treatments at different time points in V. rupestris or V. riparia cells treated with 155 mM NaCl after 0.75mM of GdCl3 pretreatment for 2 min or by 1 mM CaCl alone for 1 and 3h. Control samples were treated by H2O or 0.75mM of GdCl3 for 1h. Error bars represent SE, and different letters indicate significant differences among treatments (LSD (P<.05)).