Download

1 / 18
310 likes | 1.97k Vues
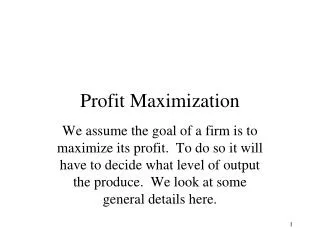
The Goal Of Profit Maximization. What is the firm’s goal? A firm’s owners will want the firm to earn as much profit as possible Why? Managers who deviate from profit-maximizing for too long are typically replaced either by Current owners or

E N D
The Goal Of Profit Maximization • What is the firm’s goal? • A firm’s owners will want the firm to earn as much profit as possible • Why? • Managers who deviate from profit-maximizing for too long are typically replaced either by • Current owners or • Other firms who acquire the underperforming firm and then replace management team with their own
Two Definitions of Profit • Profit = sales revenue minus costs of production • Accounting profit = Total revenue – Accounting costs • Economic profit = Total revenue – All costs of production = Total revenue – (Explicit costs + Implicit costs) • This last term is the opportunity cost of production
Two Definitions of Profit • Proper measure of profit for understanding and predicting firm behavior is economic profit • Unlike accounting profit, economic profit recognizes all the opportunity costs of production—both explicit and implicit costs
Why Are There Profits? • Economists view profit as a payment for • Risk-taking • Someone—the owner—had to be willing to take the initiative to set up the business • This individual assumed the risk that business might fail and the initial investment be lost • Innovation • In almost any business you will find that some sort of innovation was needed to get things started
The Firm’s Constraints: Demand • Demand curve facing firm is a profit constraint • Curve that indicates for different prices, quantity of output customers will purchase from a particular firm • Can flip demand relationship around • Once firm has selected an output level, it has also determined the maximum price it can charge • Leads to an alternative definition • Shows maximum price firm can charge to sell any given amount of output
Total Revenue • The total inflow of receipts from selling a given amount of output • Each time the firm chooses a level of output, it also determines its total revenue • Why? • Total revenue— PxQ
The Cost Constraint • Every firm wants to reduce costs, but there is a limit to how low costs can go • The firm uses its production function, and the prices it must pay for its inputs, to determine the least cost method of producing any given output level
Total Revenue and Total Cost Approach • At any given output level, we know • How much revenue the firm will earn • Its cost of production • Loss • A negative profit—when total cost exceeds total revenue • In the total revenue and total cost approach, the firm calculates Profit = TR – TC at each output level • Selects output level where profit is greatest
The Marginal Revenue and Marginal Cost Approach • Marginal revenue • Change in total revenue from producing one more unit of output • MR = ΔTR / ΔQ • Tells us how much revenue rises per unit increase in output
The Marginal Revenue and Marginal Cost Approach • What does it mean when MR is positive? • When a firm faces a downward sloping demand curve, each increase in output causes • Revenue gain • From selling additional output at the new price • Revenue loss • From having to lower the price on all previous units of output • Marginal revenue is therefore less than the price of the last unit of output
Using MR and MC to Maximize Profits • Marginal revenue and marginal cost can be used to find the profit-maximizing output level • Logic behind MC and MR approach • An increase in output will always raise profit as long as marginal revenue is _____ than marginal cost (MR __ MC) • Converse of this statement is also true • An increase in output will lower profit whenever marginal revenue is ___ than marginal cost (MR ___ MC) What should the firm do when MC>MR? What should the firm do when MC<MR?
Profit Maximization Using Graphs • How is the marginal revenue curve related to the total revenue curve • Total revenue (TR) is plotted one the vertical axis, and quantity (Q) on the horizontal axis • So what is the marginal revenue?
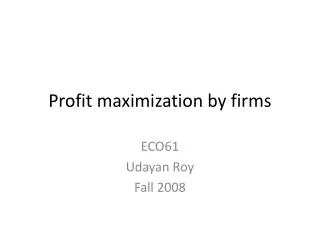
Dollars $3,500 3,000 2,500 2,000 1,500 1,000 500 0 1 1 2 3 4 5 6 7 8 9 10 Output Figure 2a: Profit Maximization TC Profit at 7 Units Profit at 5 Units Profit at 3 Units TR DTR from producing 2nd unit DTR from producing 1st unit Total Fixed Cost
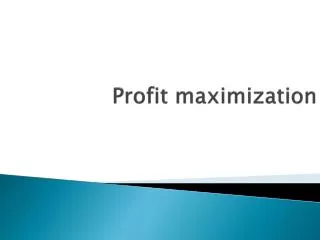
Dollars 600 500 400 300 200 100 0 Output 7 1 2 3 4 5 6 8 –100 –200 Figure 2b: Profit Maximization MC profit rises profit falls MR
The TR and TC Approach Using Graphs • To maximize profit, firm should • Produce quantity of output where vertical distance between TR and TC curves is greatest and • TR curve lies above TC curve
The MR and MC Approach Using Graphs • Figure 2 also illustrates the MR and MC approach to maximizing profits • To maximize profits the firm should produce level of output closest to point where MC = MR • Level of output at which the MC and MR curves intersect • This rule is very useful—allows us to look at a diagram of MC and MR curves and immediately identify profit-maximizing output level
An Important Proviso • Important exception to this rule • Sometimes MC and MR curves cross at two different points • In this case, profit-maximizing output level is the one at which MC curve crosses MR curve from below • Why????