Download
1 / 12
120 likes | 284 Vues
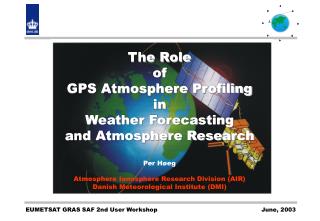
The Role of GPS Atmosphere Profiling in Weather Forecasting and Atmosphere Research Per Høeg Atmosphere Ionosphere Research Division (AIR) Danish Meteorological Institute (DMI). The EPS/METOP Satellite. The Observational Method. The fundamental observable is the signal Doppler shift.

E N D
The RoleofGPS Atmosphere ProfilinginWeather Forecastingand Atmosphere ResearchPer HøegAtmosphere Ionosphere Research Division (AIR)Danish Meteorological Institute (DMI) EUMETSAT GRAS SAF 2nd User Workshop
The Observational Method • The fundamental observable is the signal Doppler shift. • Knowledge of the observational geometry results in the phase shift due to the medium along the ray path. • The ionosphere, stratosphere and troposphere cause signal phase and amplitudechanges. Dry term Wet term Ionos. term
Advantages of GPS Atmosphere Profiling • Absolute measurement • The technique needs no calibration. The basics of the observation are a measurement of time. • Global coverage • The geometry of the observation leads for one satellite to evenly distributed data on a 24-hour interval. Observations over seas and oceans (covering 70% of the Earth) minimize the major error source in accuracy of weather forecast and climate models. • High vertical resolution • The vertical resolution limited by the Fresnel zone of the observation leads to information of atmosphere phenomena with scale sizes less than 0.5 km. • Insensitive to clouds and precipitation • The wavelengths applied makes the measurement transparent to clouds and rain hampering other space techniques. • Data delivery • The EPS/METOP mission will deliver the operational data products with 3 hours of observation.
Winter Frontal Zones and Jet Streams The major frontal zones (left panel) and jet streams (upper panel) during winter. The shaded regions (left panel) indicate major temperature contrasts mostly along mountain ranges and coasts. Arrows depict the dominant direction of the winds including the highs driving the wind patterns.
Weather Prediction Main indicators:Wind, Temperature, Pressure, Water Vapor • Requirements for improved weather forecasting • Temperature: < 0.3 % [180 – 335 K] • Pressure: < 0.3 % [0.5 – 1100 hPa] • Water vapor: < 20 % [1 – 45 hPa] • Coverage: global [data separation < 500 km]
Weekly Coverage of Profiles • Weekly latitudinal distribution of occultations. Longitudinal variations still exist in the seven days simulation. Part of the spread in the plot is due to this effect. • For the 500 x 500 km cells the following statistics can be calculated: • Average number of occultations in a cell: 22.49 • Standard deviation: 10.36 • Average time difference (min) between profiles in each cell as function of latitude. The simulation covers a whole week of data. • Average time difference between the occultations: 482 min [8h 2min] • Standard deviation: 216 min [3h 36min]