Statistical Data Analysis: Lecture 2
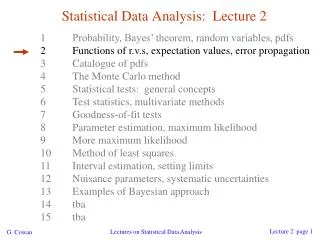
Statistical Data Analysis: Lecture 2. 1 Probability, Bayes’ theorem, random variables, pdfs 2 Functions of r.v.s, expectation values, error propagation 3 Catalogue of pdfs 4 The Monte Carlo method 5 Statistical tests: general concepts 6 Test statistics, multivariate methods

Statistical Data Analysis: Lecture 2
E N D
Presentation Transcript
Statistical Data Analysis: Lecture 2 1 Probability, Bayes’ theorem, random variables, pdfs 2 Functions of r.v.s, expectation values, error propagation 3 Catalogue of pdfs 4 The Monte Carlo method 5 Statistical tests: general concepts 6 Test statistics, multivariate methods 7 Goodness-of-fit tests 8 Parameter estimation, maximum likelihood 9 More maximum likelihood 10 Method of least squares 11 Interval estimation, setting limits 12 Nuisance parameters, systematic uncertainties 13 Examples of Bayesian approach 14 tba 15 tba Lectures on Statistical Data Analysis
Functions of a random variable A function of a random variable is itself a random variable. Suppose x follows a pdf f(x), consider a function a(x). What is the pdf g(a)? dS = region of x space for which a is in [a, a+da]. For one-variable case with unique inverse this is simply → Lectures on Statistical Data Analysis
Functions without unique inverse If inverse of a(x) not unique, include all dx intervals in dS which correspond to da: Example: Lectures on Statistical Data Analysis
Functions of more than one r.v. and a function Consider r.v.s dS = region of x-space between (hyper)surfaces defined by Lectures on Statistical Data Analysis
Functions of more than one r.v. (2) Example: r.v.s x, y > 0 follow joint pdf f(x,y), consider the function z = xy. What is g(z)? → (Mellin convolution) Lectures on Statistical Data Analysis
More on transformation of variables Consider a random vector with joint pdf Form n linearly independent functions for which the inverse functions exist. Then the joint pdf of the vector of functions is where J is the Jacobian determinant: For e.g. integrate over the unwanted components. Lectures on Statistical Data Analysis
Expectation values Consider continuous r.v. x with pdf f (x). Define expectation (mean) value as Notation (often): ~ “centre of gravity” of pdf. For a function y(x) with pdf g(y), (equivalent) Variance: Notation: Standard deviation: s ~ width of pdf, same units as x. Lectures on Statistical Data Analysis
Covariance and correlation Define covariance cov[x,y] (also use matrix notation Vxy) as Correlation coefficient (dimensionless) defined as If x, y, independent, i.e., , then → x and y, ‘uncorrelated’ N.B. converse not always true. Lectures on Statistical Data Analysis
Correlation (cont.) Lectures on Statistical Data Analysis
Error propagation Suppose we measure a set of values and we have the covariances which quantify the measurement errors in the xi. Now consider a function What is the variance of to find the pdf The hard way: use joint pdf then from g(y) find V[y] = E[y2] - (E[y])2. may not even be fully known. Often not practical, Lectures on Statistical Data Analysis
Error propagation (2) Suppose we had in practice only estimates given by the measured Expand to 1st order in a Taylor series about To find V[y] we need E[y2] and E[y]. since Lectures on Statistical Data Analysis
Error propagation (3) Putting the ingredients together gives the variance of Lectures on Statistical Data Analysis
Error propagation (4) If the xi are uncorrelated, i.e., then this becomes Similar for a set of m functions or in matrix notation where Lectures on Statistical Data Analysis
Error propagation (5) y(x) The ‘error propagation’ formulae tell us the covariances of a set of functions in terms of the covariances of the original variables. sy x sx Limitations: exact only if linear. y(x) Approximation breaks down if function nonlinear over a region comparable in size to the si. ? x sx N.B. We have said nothing about the exact pdf of the xi, e.g., it doesn’t have to be Gaussian. Lectures on Statistical Data Analysis
Error propagation − special cases → → That is, if the xi are uncorrelated: add errors quadratically for the sum (or difference), add relative errors quadratically for product (or ratio). But correlations can change this completely... Lectures on Statistical Data Analysis
Error propagation − special cases (2) Consider with Now suppose r = 1. Then i.e. for 100% correlation, error in difference → 0. Lectures on Statistical Data Analysis
Wrapping up lecture 2 We know how to determine the pdf of a function of an r.v. single variable, unique inverse: also saw non-unique inverse and multivariate case. We know how to describe a pdf using expectation values (mean, variance), covariance, correlation, ... Given a function of a random variable, we know how to find the variance of the function using error propagation. also for covariance matrix in multivariate case; based on linear approximation. Lectures on Statistical Data Analysis


![MChem Computing and Chemistry [B14SC3]](https://cdn2.slideserve.com/4721763/mchem-computing-and-chemistry-b14sc3-dt.jpg)