T-Tests For Dummies
T-Tests For Dummies. As in the books, not you personally!. From Yesterday’s Notes.


T-Tests For Dummies
E N D
Presentation Transcript
T-Tests For Dummies As in the books, not you personally!
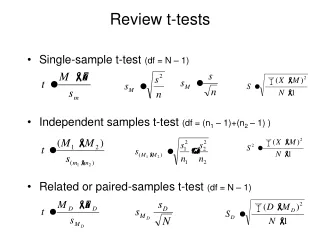
From Yesterday’s Notes • Note that the numerator of the formula for t is the difference between the means. The denominator is a measure of the experimental error in the two groups combined. The wider the difference between the means, the more confident you are in the data. The more experimental error you have, the less confident you are in the data. Thus, the higher the value of t, the greater the confidence that there is a difference. • So, the t value gives you a statistical measure of (a degree of) how different your two means are, based on the size of your samples.
Bar Plots • Sometimes it is easy to observe a difference between two means by using a bar plot, for example: • But that’s not enough! You need to use a statistical test for proof.
So you calculate two means and see that they are different… SO WHAT!!?? • What you really should be asking, is: “Is the fact that there is an observed difference between the two means significant, or not?”
Well, to determine the answer to this question, we need something to compare to. • So we use the t-table: a set of statistical measures of the amount of difference between two means that you can expect to see due to random sampling (chance) • These measures are based on the size of the samples specifically, what we calculate as the degrees of freedom
Now, as with any statistical measure, there is going to be some degree of error. • So, the t-table gives the expected t-values due to chance in terms of particular probabilities (it gives a measure of mean difference due to chance with different degrees of error) • In biology, we are generally concerned with p=0.05 (in other words, 95% confidence), and p=0.01 (or 99% confidence).
Putting it all together • So let’s say for example that you take two samples of size 10 and calculate their means. • You see that the means are different and use the null hypothesis as a basis for your t-test (as any skilled scientist would do) • You calculate your t-value and obtain 4.73 (right off the bat, for a sample size of 10, you should be thinking: wow! that’s a large t-score) • So you’re thinking that the difference you observed between the means is significant… WELL PROVE IT!!!!
THE PROOF • So you consult your trusty t-table and see that for 18 d.f., your calculated t-value exceeds ALL of the theoretical t-values listed in the table (by A LOT, I might mention) • So what, then, do you conclude?
THE PROOF • Well, the fact that your t-value (a measure of the degree of difference in your means) exceeds the critical values in the table (measures of the degree of difference b/w means due to chance) means that the difference b/w the sample means that you observed IS SIGNIFICANT! • So you REJECT the null hypothesis that there is no difference, and accept your alternative hypothesis that there is a difference between your means (and that it’s not due to sampling error or chance!)
TEST TIME! • Clear off your desks! • Stop reading this powerpoint! • Get your calculators out! • Good luck!!!!!!!