ChIP-seq analysis
Ecole de bioinformatique AVIESAN – Roscoff, Jan 2013. ChIP-seq analysis. Work flow for chip-seq analysis. Data retrieval. ChIP-seq data can be retrieved from specialized databases such as Gene Expression Omnibus (GEO).

ChIP-seq analysis
E N D
Presentation Transcript
Ecole de bioinformatique AVIESAN – Roscoff, Jan 2013 ChIP-seq analysis
Work flow for chip-seq analysis Data retrieval • ChIP-seq data can be retrieved from specialized databases such as Gene Expression Omnibus (GEO). • The GEO database allows to retrieve sequences at various processing stages. • Read sequences: typically, several millions of short sequences (36bp). • Read locations: chromosomal coordinates of each aligned read. Typically, several millions of coordinates of short fragment (36bp). • Peak locations: several thousands of variable size regions (typically between 100bp and 10kb). • A technological bottleneck lies in the next step: exploitation of full peak collections to discover motifs and predict binding sites. GEO Raw reads + quality(fastq) Read clean-up Cleaned reads Read mapping Alignments Peak calling Peaks Motif discovery Over-represented motifs Pattern matching Binding sites
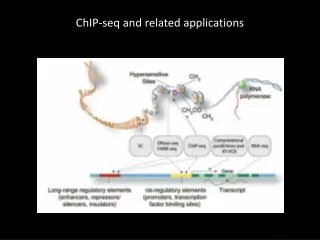
Read pre-processing and mapping Raw reads (fastq) • Conversion • bamToBed (bedtools) • Quality checking • fastqc • Adaptor trimming • cutadapt Read coordinates (bed) Trimmed reads (fastq) Quality report (html) • Conversion • ??? (Kent tools) • Quality filtering • prinseq Genomic density profile (bedgraph, bg) Quality-filtered reads (fastq) • Duplicate filtering • rmdup (samtools) • Conversion • bedgraphToBigWig (Kent tools) Duplicate-filtered reads (fastq) Genomic density profile (bigwig, bw) • Read mapping • bowtie (Tuxedo) Alignments (sam) • Compression • view (samtools) Compressed alignments (bam) • Sorting by genomic coordinates • sort (samtools) Sorted alignments (bam) • Visualization • IGV • IGB • tracker (Galaxy) • UCSC genome browser • Indexing • index (samtools) Legend Alignment index (bai) User input Image Program Result
From reads to peaks Test alignments (bam) Input alignments (bam) • Peak calling • MACS • SICER • PeakFinder • SPP • SWEMBL • ... Enriched regions or peaks (bed) Genomic density profile (wig) Quality checking - fastqc Adaptor trimming - cutadapt Trimmed reads (fastq) Quality report (html) Quality filtering - prinseq Legend User input Program Result
Slicing the peak collection Slice 1 (top) • Recipe • Sort peaks by decreasing score • Select • n top peaks (“top slice”) • n bottom peaks (“bottom slice”) • a few intermediate slices of n peaks • Analyse enrichment for a reference motif (annotated or discovered from the data) in the successive slices. Slice 2 Slice 3 Slice 4 Slice 5 (bottom)
GATA3 – reasonably good peak collection sample: GSM774297
GATA3 – poor quality peak collection • The top slice shows some enrichment • The other slices are no more enriched than the theoretical (random) expectation • Negative control: scanning sequences with permuted matrices fits the theoretical expectation. sample: GSM523222