Download
1 / 17
170 likes | 299 Vues
A Case Study of an Outbreak of Twin Tropical Cyclones. Carl J. Schreck, III Department of Earth and Atmospheric Sciences University at Albany, SUNY. Introduction. Twin tropical cyclones typically occur in the Pacific Ocean about 2.4 times per year (Keen 1982)

E N D
A Case Study of an Outbreak of Twin Tropical Cyclones Carl J. Schreck, III Department of Earth and Atmospheric Sciences University at Albany, SUNY
Introduction • Twin tropical cyclones typically occur in the Pacific Ocean about 2.4 times per year (Keen 1982) • Three sets of twins form in the Central Pacific during a 1-month period in October 1997 • This study investigates the background and synoptic conditions that led to this outbreak of twin tropical cyclones
Data • JTWC Best Track • Cyclogenesis is defined as the first fix for a given storm • Reynolds OI SSTs • CLAUS brightness temperature • ECMWF operational analyses
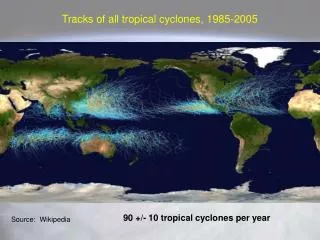
Tropical cyclogenesis within 15° latitude of equator • Northern Hemisphere storms indicated by red-filled symbols • Southern Hemisphere storms indicated by blue-filled symbols • Three sets of twin tropical cyclones form during October 1997 8.6° 6.75 days 1.5° 42 h 24 h 2.8°
Mean SST for October 1997 • Hurricane symbols indicate genesis locations of twin tropical cyclones
Averaged 20 September – 9 November 1997 • 1000-hPa Wind (vectors) and Height (contours) • Brightness Temperature (Tb, shading)
Averaged 20 September – 9 November 1997 • 700-hPa Wind (vectors) and Relative Vorticity (shading)
Averaged 20 September – 9 November 1997 • Mean 850–200-hPa Vertical Shear • Vector-mean (vectors) • Scalar-mean (shading)
Summary of Background Conditions • All three sets of twin tropical cyclones form in a region where conditions are favorable for cyclogenesis within 10° latitude of the equator in both hemispheres • Warm water • Lower 1000-hPa heights • Active convection • Lower-tropospheric cyclonic vorticity • Relatively low or easterly vertical shear • But these favorable conditions are broad and long-lasting. Why did the twins form where & when they did?
Synoptic Maps of Tb and 700-hPa winds every 6 days • Hurricane symbols indicate genesis of twin storms within 3 days of plot
Unfiltered Tb • Averaged 10°S–10°N • Lower values (convection) in warm colors • Unfiltered u • Averaged 4.5°S–4.5°N • Westerlies in warm colors • Easterlies in cool colors
30-Day Low-pass and 10–30 Day Band-pass Filtered Tb (shading) and u (contours)
Summary of Synoptic Conditions • Unfiltered Tband u show evidence of two primary modes: • Low-frequency eastward propagation • Appears most clearly in the 30-day low-pass filtered Tb • Phase speed ≈ +1.8 m s−1 • Possibly associated with a slowly moving MJO event • Higher-frequency westward propagation • Appears most clearly in 10–30 band-pass u • Phase speed ≈ −6.7 m s−1 • Period ≈ 18.5 days • Fits n = 1 ER wave dispersion for H ≈ 65 m • Twins form during periods of equatorial westerlies and active convection
u • Vertical lines indicate tropical cyclogenesis • Unfiltered data in gray • 30-day low-pass filtered data in green • 10–30-day band-pass filtered data in red • Sum of 10-30 day band-pass and 30-day low-pass filtered data in black Tb
Summary of Time–Amplitude Plots • The sum of 10-30 day band-pass and 30-day low-pass filters qualitatively captures much of the unfiltered evolution in u and Tb • Neither mode alone can explain all of the twin tropical cyclones • The twin tropical cyclones form when the sum of the modes is • u > 5 m s−1 • Tb < 275 K
Summary & Conclusions • Three sets of twin tropical cyclones form in the Central Pacific during a 1-month period (October 1997) • These twins form in a broad region of favorable conditions near the equator in both hemispheres • Warm water • Lower 1000-hPa height • Active convection • Lower-tropospheric cyclonic vorticity • Relatively low vertical shear
Summary & Conclusions • The active convection and the equatorial westerlies/relative vorticity seem to be modulated by two modes • Low-frequency eastward moving mode (MJO?) • Higher-frequency westward moving mode (ER waves?) • No storms form during the anticyclonic (convectively suppressed) phase of the ER waves • Both modes appear to be important for the formation of the twins