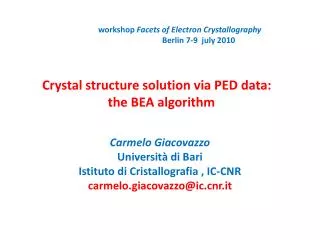
Crystal structure solution via PED data: the BEA algorithm
workshop Facets of Electron Crystallography Berlin 7-9 july 2010. Crystal structure solution via PED data: the BEA algorithm. Carmelo Giacovazzo Università di Bari Istituto di Cristallografia , IC-CNR carmelo.giacovazzo@ic.cnr.it. PED-Direct Methods.

Crystal structure solution via PED data: the BEA algorithm
E N D
Presentation Transcript
workshop Facets of Electron Crystallography Berlin 7-9 july 2010 Crystal structure solution via PED data:the BEA algorithm Carmelo Giacovazzo Università di Bari Istituto di Cristallografia , IC-CNR carmelo.giacovazzo@ic.cnr.it
PED-Direct Methods • Recently introduced PED techniques reduce the number of reflections which are simultaneously excited and therefore allow to describe the scattering by few beam approximations. • Most of the statistical features of PED amplitudes are still unknown, with particular attention to the effects they produce on the efficiency of the phasing procedures, specifically on Direct Methods approaches, which so far are the most popular phasing techniques.
A relatively large number of test cases is used. • In our tests we use the amplitudes kindly provided by some friends ( Gemmi, Mugnaioli, Kolb) for solving the structures: no attempt for improving them by techniques correcting for dynamical effects. • As overall result, a number of recipes ( among which the BEA algorithm) are obtained, which make the crystal structure solution via PED data more straightforward.
PED-ADT techniques • Although PED techniques curtail the problem of dynamical diffraction, it is difficult to collect fully 3-dimensional data by them. • Usually 2-dimensional reflections from few well oriented zone axis are collected. • More recently the ADT technique has been developed which, in combination with PED, allows much larger completeness values. Five of our twelve test data were collected by combiningPEDwithADT.
Data resolution . • ED reveals the electrostatic potential, which is the sum of nuclear and of electronic potentials: viceversa, the electrostatic potential around each atom influences the atomic scattering. • The region substantially determining ED scattering amplitudes is wider than for XD: therefore the atomic scattering curve for ED more rapidly decreases with s than the corresponding X-ray curves.
Data Resolution • In Fig. we show carbon and sulphur atomic scattering curves for e- and X-ray scattering: ED curves have been rescaled so that their maximum values are equal to Z.
Carbon and sulphur atomic scattering curves versus RES for XD (blue lines) and, after rescaling, for ED (red lines)
The more rapid decay of the electron scattering may suggest that ED data should be detectable only at resolution smaller than for X-rays. This effect however is contrasted by the stronger electron scattering (1000 times about) than X-rays, but is strengthened by the smaller size of the crystal samples submitted to electron diffraction. As a first conclusion, PED data can really attain quite high resolution as effect of three sample parameters (electrostatic potentials, strength of the scattering, size of the crystal) and of the shorter wavelength (much shorter than for X-rays): their data quality versus the resolution, however, has still to be assessed. c
Data Resolution • In conclusion, the shorter electron wavelength combined with PED techniques allows to collect data at very high resolution, but their measurement errors are expected to be particularly large. • However we will show below that such reflections may be useful in the phasing process, and contribute to make the structural model more complete.
Data completeness • COMP=data completeness=number of measured / number of measurable reflections, at RES and at 0.9 Å resolution. • NR= corresponding number of symmetry independent reflections. • COMP is quite unsatisfactory when the nominal RES value is smaller than 0.4 Å: in particular data collected by combining PED and ADTshow lower resolution but better data completeness, so providing a better basis for accurate crystal structure refinement.
Data Quality Indications on the data quality may be obtained by the internal R-value The sum is over symmetry equivalent reflections. Since X-Ray structures are known the kinematical data quality may be estimated via The sum is over the measured reflections
Direct Methods (DM) • 200 trials were run for each test structure by using Sir2008 (Version 3.0), included in the package Il Milione . • DM section is automatically followed by a direct space procedure which, viaEDM techniques and diagonal LSQ, tries to improve DM models. • RESID is used as a FOM for recognizing the correct solution. All the following results are referred to the best solution found within the five trials with the lowest values of RESID.
Protocols • We used three different protocols. • Protocol 1. All the measured data up to RES are used in the phasing process. • Protocol 2. Only data up to 0.7 Å resolution were used in the phasing process • Protocol 3. Only data up to 0.9 Å resolution were used in the phasing process. • The results are in the figure
Model quality • The analysis of the results suggests that: • the structure models obtained by Prot.1 are more complete than those obtained by Prot.2, which are more complete than those obtained by Prot. 3. • This behavior may be related to the recent use of the extrapolation techniques in protein structure determination, where phases and amplitudes of non-measured (because out of the measured reciprocal space) reflections are estimated via probabilistic approaches and used during the phase determination process.
Model quality • The RESID values available at the end of the automatic phasing process ( where peaks are labeled, and thermal factors are still isotropic) are shown in the next Fig. . Obviously they are larger for Prot.1 than for Prot.2 than for Prot.3. • Most of the RESIDvalues are far from the values obtained by Sir2008 for X-ray data (usually between 0.08 and 0.12).
About the BEA algorithm If PED techniques are used, the dynamical effects are no more dominant but still present. Two questions arise: 1) Is the average ( over symmetry equivalent reflections) a good representative of the correct intensity? A: yes and no 2)In absence of a theoretical formulation establishing which of the equivalent reflections is less affected by dynamical scattering, can one use a practical criterion for selecting the best unique reflection?
The BEA algorithm • BEA suggests to choose as unique reflection that one which better agrees with the current structural model. • The effect is certainly cosmetic (the final RESID value may be much smaller than that obtained by using the average of the equivalent amplitudes). But it may also be substantial: i.e., the crystal structure solution becomes more straightforward and the final structural model may be more complete. We call this algorithm BEA (best equivalent amplitude).
The BEA algorithm • BEA has some similarity with a criterion used in powder crystallography during the phasing process. • When a structural model is not available the experimental diffraction profile is decomposed according to LeBail or to Pawley algorithms. • If a structural model is available, the experimental diffraction profile is partitioned in a way proportional to the calculated structure factors of the overlapping reflections.
The BEA procedure • When Direct Methods are run, the average amplitude of the symmetry equivalent reflections is used (no structural model is available at this stage). • As soon as a model is available, the best equivalent reflection may be recognized and the corresponding amplitude is used as coefficient of the observed Fourier maps and as observed amplitude in the diagonal least-squares automatically performed by Sir2008. • Obviously the best reflection changes with the structural model.
In the ED case BEA recognizes that uncorrected dynamical effects still affect the experimental data (even in the PED case), that such effects are not corrected by a posteriori techniques, and that the merging of the symmetry equivalent reflections may lead to averaged values which are not good representatives of the true intensities.
Check BEA • To check BEA we used the following three protocols. • Prot. 4. All the measured data up to RES are used in the phasing process (as in Protocol 1), and BEAis used. • Prot. 5. Only data up to 0.7 Å resolution were used in the phasing process (as in Protocol 2), and BEA is applied. • Prot. 6. Only data up to 0.9 Å resolution were used (as in Protocol 3) and BEA is applied.
Compare the results attained via Protocols 4,5,6 with those obtained via Protocols 1,2,3 respectively (compare protocol i and i+3, because they imply the same data resolution). • We observe that the use of BEA: • A)usually leads to more complete structural models. • B)may strongly improve the RESID values, particularly when the nominal data resolution is high, and makes them very close to the X-ray values usually obtained at this stage of refinement.
Efficiency of Prots. 1 and 4 • Prot. 1- Sir2008 is able to find a complete solution in all the cases except for anatase (one O and one Ti atom in the asymmetric: Ti was missed), barite (4 atoms over 5 well located: one O was missed), mullite (one O missed), srtio3_s ( Ti and Ca-Sr atoms were missed) . • Prot 4- All the atomic positions of the test structures were found, but for mullite, for which one O with chemical occupancy equal to 0.14 was missed.
Advantages of BEA • It usually leads to more complete structural models. • It may strongly improve the RESID values, particularly when the nominal data resolution is high, and makes them very close to the values usually obtained for X-ray data at this stage of refinement. • More extended applications are needed to extrapolate the usefulness of BEA for the final refinement stages.