Download
1 / 13
130 likes | 341 Vues
Ecological pyramids and productivity. Activities. Complete first and second page of Zoo assignment Complete food chain and food web sheet. Ecological pyramids. Represent trophic levels in an ecosystem Do not show specific eating relationships Detritivores and decomposers usually omitted

E N D
Activities • Complete first and second page of Zoo assignment • Complete food chain and food web sheet
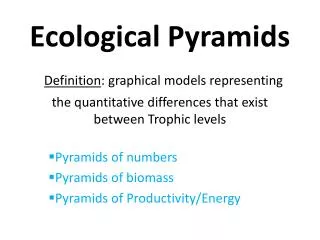
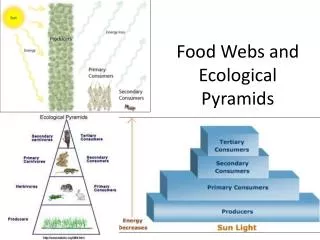
Ecological pyramids • Represent trophic levels in an ecosystem • Do not show specific eating relationships • Detritivores and decomposers usually omitted • The length of the bar at each level of the pyramid shows the relative measurement of the trophic level in terms of numbers, biomass or energy
Pyramid of numbers • Shows number of organisms at each trophic level per unit area of ecosystem Pyramid shaped is the most common, but sometimes the shape may be inverted or spindle shaped
Pyramid of biomass • Biomass is the amount (weight) of dry organic matter at a trophic level at a particular time If biomass is measured only over a short period of time, pyramid may be inverted, as higher level organisms often take longer to build up biomass
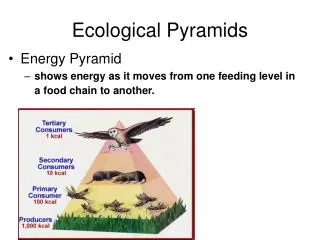
Pyramid of energy • Shows amount of energy INPUT into each trophic level • Never inverted. (why?)
Activities Glossary: Ecological pyramid, biomass, pyramid of numbers, pyramid of biomass, pyramid of energy Quick check pg 454
Productivity • Rate at which chemical energy is produced in an ecosystem • Expressed in units such as “grams of organic matter per square metre per year”
Production: gross and net • Gross Primary Production (GPP) = chemical energy produced over a given period of time • R = energy that is used by the producers within their lifetime • Net Primary Production (NPP) = amount of energy available to consumers NPP = GPP - R
In general, those ecosystems with the highest net productivity are those with the greatest producer biomass More chemical energy stored in organic matter More producer biomass More photosynthesis Other limiting factors of productivity:
Deep sea ecosystems • May survive on organic matter that floats down from surface-dwelling organisms • Few organisms live at these depths
Chemosynthesis • No light = no photosynthesis • Chemosynthesis = bacteria use chemical reactions occurring at sea vents to produce organic matter
Activities Glossary: productivity, gross primary productivity, net primary productivity, chemosynthesis Quick check pg 458, pg 460