Download
1 / 92
920 likes | 1.03k Vues
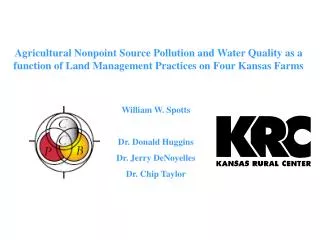
Agricultural Nonpoint Source Pollution and Water Quality as a function of Land Management Practices on Four Kansas Farms. William W. Spotts Dr. Donald Huggins Dr. Jerry DeNoyelles Dr. Chip Taylor. Introduction. Agricultural nonpoint source pollution Best management practices (BMPs)

E N D
Agricultural Nonpoint Source Pollution and Water Quality as afunction of Land Management Practices on Four Kansas Farms William W. Spotts Dr. Donald Huggins Dr. Jerry DeNoyelles Dr. Chip Taylor
Introduction • Agricultural nonpoint source pollution • Best management practices (BMPs) • Research: sampling and modeling
Agricultural nonpoint source pollution (NPSP) • The USEPA has identified agricultural NPSP as the major source of stream and lake contamination preventing attainment of the water quality goals identified in the Clean Water Act. (1988). • What ? Nutrients, pesticides, sediment, pathogens • Who? Livestock and cropping systems • How ? Diffuse, episodic, weather-driven • Where ? KDHE 97% of streams and 80% of lakes • Why ? Impacts water quality, aquatic communities, reservoirs
Nonpoint source pollution: Cropland • Tillage • Field applications
Erosion Fecal coliform N and P loading Nonpoint source pollution: Livestock
Introduction • Agricultural nonpoint source pollution • Best management practices (BMPs) • Research: sampling and modeling
Best Management Practices (BMPs) Methods, measures or practices designed to prevent or reduce pollution • Structural controls • Source controls • Land management How do you measure the “effectiveness” of BMPs?
Introduction • Agricultural nonpoint source pollution • Best management practices (BMPs) • Research: monitoring and modeling
Monitoring: Describe trends, evaluate effectiveness Modeling: Predict pollutant movement Goal: Provide reliable estimates of pollutant loads Application: Total Maximum Daily Load (TMDL) Research: monitoring and modeling
Project overview • Clean Water Farms Project • Four farms with different land management practices • Runoff and groundwater for 2-5 years • SIMPLEX for comparisons
Important Questions • What are typical edge of field concentrations relative to different land management practices ? • What factors influence agricultural water quality? • How do experimental values compare to the expected values? • Can changes in land management lower nutrient and herbicide levels in groundwater and field runoff ?
Experimental methods • Monitoring program design • Sampling efforts • SIMPLEX Loading Model
Aspects of a NPSP monitoring program • Goals • Management • Opportunistic • Adaptable • Participation
Runoff sampling • Sigma 800SL • Edge of field data • First flush runoff
Sampling Shallow Groundwater • Lysimeter clusters Depth • Transect approach Space
Nitrogen Phosphorus Atrazine Primary agricultural nonpoint source pollutants
Modeling RunoffSIMPLEX Nutrient Loading Version 1.0 • Goal: Estimate runoff volumes • ArcView GIS • Aerial Photos (DOQQ) • Land Use / Land Cover (site visits) • Drainage area (DRG) • Soils (SSURGO) • Inputs: Watershed area, LU/LC and precipitation
Monitoring crop production systems • Land management practices • Stripped-crop rotation • No-till crop production
Bartel farm: Stripped-crop rotation • Marion County • French Creek Watershed • Concerns • Marion Reservoir • Soil fertility and erosion • Sampling: Runoff and groundwater • Objectives: Nutrient concentrations relative to the crop rotation
Field applications of “compost” around the sampling sites were unexpected
Mean* nutrient and herbicide concentrations at the Bartel farm lower site
TN in runoff at the lower samplerBartel farm Before field applications After field applications
TP in runoff at the lower samplerBartel farm Before field applications After field applications
SIMPLEX Volume calculations Watershed area = 52.2 hectares or 130 Acres
Groundwater on the Bartel farm • Two clusters • Sampled eleven times • Nitrogen • Phosphorus • Atrazine
Total nitrogen in groundwater at both sites Bartel farm stripped-crop rotation
Total phosphorus in groundwater at both sites Bartel farm stripped-crop rotation
Monitoring crop production systems • Land management practices • Stripped-crop rotation • No-till crop production
Peters Farm: No-Till • Marion County • South Cottonwood Watershed • Concerns • Nutrients and herbicides in runoff • Groundwater contamination • Soil erosion Sampling: Runoff and groundwater Objectives: Monitor trends in nutrient and herbicide concentrations relative to no-till practices.
Mean* nutrient and herbicide concentrationsPeters No-till farm
TN in first flush runoff on the Peters farm 100 Sampling Date Jun 22, 98 Sep 20, 98 Oct 2, 98 Oct 11, 98 10 Nov 10, 98 Jun 16, 99 Concentration (mg/L) Aug 1, 99 Nov 22, 99 1 .1 0 20 40 60 90 120 150 180 Time (minutes)
TP in first flush runoff on the Peters farm 10 Sampling Date Jun 22, 98 Sep 20, 98 1 Oct 2, 98 Oct 11, 98 Nov 10, 98 Jun 16, 99 Concentration (mg/L) .1 Aug 1, 99 Nov 22, 99 .01 .001 0 20 40 60 90 120 150 180 Time (minutes)
Atrazine in first flush runoff on the Peters farm 1000 Sampling Date Jun 22, 98 100 Sep 20, 98 Oct 2, 98 Oct 11, 98 10 Jun 16, 99 Aug 1, 99 Concentration (ug/L) 1 .1 .01 .001 0 20 40 60 90 120 150 180 Time (minutes) Kansas statewide average: 1.12 ug/L Watershed average: 1.54 ug/L