Download
1 / 48
480 likes | 661 Vues
Mapping the Zone: Improving Flood Map Accuracy. David Maidment, Chair Gerry Galloway. Briefing for FEMA January 15, 2009. Committee Charge: Task 3. 3. Investigate the impact that various study components (i.e., variables) have on the mapping of flood inundation boundaries:

E N D
Mapping the Zone: Improving Flood Map Accuracy David Maidment, Chair Gerry Galloway Briefing for FEMA January 15, 2009
Committee Charge: Task 3 3. Investigate the impact that various study components (i.e., variables) have on the mapping of flood inundation boundaries: a. Riverine flooding • The accuracy of digital terrain information • Hydrologic uncertainties in determining the flood discharge • Hydraulic uncertainties in converting the discharge into a flood water surface elevation b. Coastal flooding • The accuracy of the digital terrain information • Uncertainties in the analysis of the coastal flood elevations c. Interconnected ponds (e.g., Florida) • The accuracy of the digital terrain information • Uncertainties in the analysis of flood elevations
Committee Membership Practitioners Academics Geodesy Hydrology Coastal Economics Risk David Maidment, Chair, University of Texas David Brookshire, University of New Mexico J. William Brown, City of Greenville, South Carolina John Dorman, State of North Carolina Gerald Galloway, University of Maryland Bisher Imam, University of California, Irvine Wendy Lathrop, Cadastral Consulting David Maune, Dewberry Burrell Montz, Binghamton University Spencer Rogers, North Carolina Sea Grant Karen Schuckman, Pennsylvania State University Y. Peter Sheng, University of Florida Juan Valdes, University of Arizona
Previous NRC Studies:Flood Map Technologies (2007) • An examination of the accuracy of flood base map input data • 2D imagery and planimetrics • 3D elevation • Prompted by issues raised by Senate Appropriations Committee staff
Adjusted goal: 92% of population and 65% of land area will have a modernized map 21% of population has maps meeting the floodplain boundary standard and engineering study standard
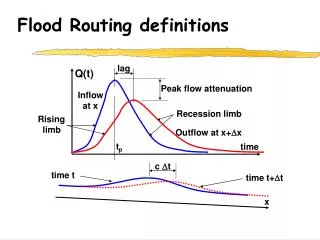
Flood Maps Coastal Riverine Two very different flood modeling and mapping problems
Riverine Flood Mapping • Modeling and mapping technology is well established • Supported by a large observation database at stream gages • Floods flow along the line of the stream gages
Coastal Flood Mapping • Modeling and mapping technology and guidance are evolving • Storm surges inland transverse to the line of tide gages • Large dependence on models, less on historical flood data
Terrain data accuracy matters USGS NED (30m) NCFMP Lidar (3m) Inundation for a 1ft storm surge or sea level rise in the Tar-Pamlico estuary (Source: USGS)
Lidar of inundated water surface elevation during Iowa flood (2008) Source: University of Iowa and National Center for Airborne Laser Mapping
Three systems for measuring elevation Orthometric heights (land surveys, geoid) Ellipsoidal heights (lidar, GPS) Tidal heights (Sea water level) Conversion among these height systems has some uncertainty
Trends in Tide Levels(coastal flood risk is changing) Charleston, SC + 1.08 ft/century 1900 2000 Galveston, TX + 2.13 ft/century - 4.16 ft/century 1900 2000 Juneau, AK 1900 2000
Importance of geodetic datumsNAVD88 – NGVD29 (cm) NGVD29 higher in East More than 1 meter difference NAVD88 higher in West Orthometric datum height shifts are significant relative to BFE accuracy, so standardization on NAVD88 is justified
North Carolina Case Studieshttp://www.ncfloodmaps.com/program_review.htm Economics H&H Studies done for the NRC Committee by the North Carolina Floodplain Mapping Program (NCFMP) Mountains of Western NC Rolling hills of Piedmont Flat coastal plain H&H and Economics (H&H = Hydrology and Hydraulics)
One River Reach studied in detail in each region(each reach 5-7 miles long)
Terrain Data for Case Studies USGS DEMs (30m) NCFPM Lidar (3m)
NED is higher (green) Lidar is higher (purple)
NED is higher (green) An elevation “bust” Systematic and random errors
Terrain Data • Our study demonstrates that there are large differences between LIDAR and NED • Random differences everywhere • Systematic differences in some places
Defining Uncertainty in BFELong term records of extreme stages recorded at USGS gages At each gage the peak stage is recorded for each year along with the peak flow – do a frequency analysis of these.
Frequency Analysis of Stage Heights at 31 gages 6 7 8 21 gages in NC Is pitted FL landscape different? All gages have at least 20 years record (average is 54 years) 10 gages in FL
Swannanoa River at Biltmore, NC (78 years of record) Base flood discharge Discharge (cfs) T = 100 years Annual Exceedence Probability Produced using the Corps HEC-SSP Program (Bulletin 17-B standard procedure)
Swannanoa River at Biltmore, NC (78 years of record) 95% CL 5% CL Stage (ft) Sampling error = T = 100 years Annual Exceedence Probability Uncertainty in BFE = Uncertainty in 100-year stage height
Sampling Error of 100-year Stage Heights Outlier (skewed frequency curve) No systematic variation in sampling error by drainage area or topographic region Sampling Error (ft) Average = 1.06 ft Drainage Area (Sq miles)
BFE and Base Stage Height differ by a constant amount (gage datum – geodetic datum) This doesn’t affect uncertainty of statistical variation of sample data around the 100-year estimate Average value of sample error at 30 of 31 gage sites is 1.06 ft A Lower Bound on the uncertainty of the BFE is a standard error of estimate of approximately one foot Uncertainty in BFE 95% CL 5% CL Base Stage Height BFE, h Gage datum Geodetic datum
Uncertainty in Floodplain Boundary Location Lateral channel slope is calculated on HEC-RAS cross-sections at the point of intersection of water surface with land surface (left and right banks) and averaged for all cross-sections in the reach dw/dh = Run/Rise w dh h dw A Lower Bound on the uncertainty of the floodplain boundary location ranges from approximately 8ft in the mountains to approximately 40 ft in the coastal plain
Hydrologic and Hydraulic Methods 100-yr Discharge Base Flood Elevation Floodplain Map Mapping Hydraulics Hydrology
Age of Rural Peak Flow Regression Equations Some equations are old Need for equations to follow basin rather than state boundaries
Effect on BFE of Variation in Hydrologic Methods(Long Creek, Mecklenburg County)
Effect of Hydrologic methods on BFE • Choice of hydrologic method affects the BFE by usually less than 1 foot • All methods in our study are calibrated to the gage frequency curve and all our reaches have a gage, so gage calibration dominates variation in hydrologic methods • Stream gage data are important
Case Study: Hydraulic Model-Terrain Variants Detailed Limited Detailed Approximate (lidar)
Effect on BFE of variation in hydraulic methods and terrain data (Swannanoa River)
Effect on BFE of variation in hydraulic methods and terrain data (Ahoskie Creek)
Effect on BFE of variation in hydraulic methods and terrain data (Long Creek) Approximate Study using NED 21 ft
Approximate Study BFE Profiles Approximate - Lidar Approximate - NED Misalignment (100 – 200 ft) of mapped 2D planimetric streamline with NED 3D elevation data
Flood Hazard Zone Areas Swannanoa River • At Ahoskie Creek and Swannanoa River the number of acres enclosed in the SFHA by Detailed and Approximate studies differs by < 1% • Difference at Long Creek = 20% Detailed - lidar Detailed - NED Approximate-NED Approximate studies give the same area of flood zone but a different shape
Interconnected Ponds (e.g. Florida) • Gage study showed that BFE uncertainty in Florida rivers is similar to NC • Many complex hydrologic issues inherent in how water reaches river from a ponded landscape • Needs a separate study Data from SWFWMD
Overarching Finding 1. Topographic data is the most important factor in determining water surface elevations, base flood elevation, and the extent of flooding, and thus the accuracy of flood maps in riverine areas
Risk The probability of an event multiplied by the consequences if the event occurs Risk = p x c Risk = p x cn p = probability (h, s) c = consequences n = variable related to social values p = probability (hazard, system) c = consequences
Conclusions • Riverine • Elevation, elevation, elevation • Coastal • Inundation process is complex • Economics • Base flood elevations are worth it • Risk • Better maps can provide good risk information