Analyzing Nonlinear Regression Techniques and Models
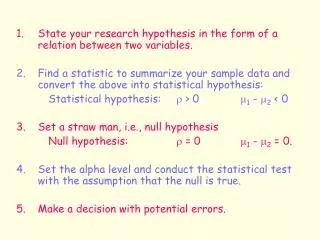
Explore transformations, logarithmic expressions, exponential equations, and curve fitting using power and exponential models with real-life examples. Understand best-fit curves and predictive modeling in data analysis.

Analyzing Nonlinear Regression Techniques and Models
E N D
Presentation Transcript
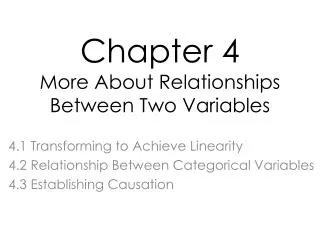
Chapter FourDescribing the Relation Between Two Variables Section 4.4 Nonlinear Regression: Transformations
EXAMPLE Using the Definition of a Logarithm Rewrite the logarithmic expressions to an equivalent expression involving an exponent. Rewrite the exponential expressions to an equivalent logarithmic expression. (a) log315 = a (b) 45 = z
In the following properties, M, N, and a are positive real numbers, with a 1, and r is any real number. loga (MN) = loga M + loga N loga Mr = r loga M
EXAMPLE Simplifying Logarithms Write the following logarithms as the sum of logarithms. Express exponents as factors. (a) log2 x4 (b) log5(a4b)
If a = 10 in the expression y = logax, the resulting logarithm, y = log10x is called the common logarithm. It is common practice to omit the base, a,when it is equal to 10 and write the common logarithm as y = log x
EXAMPLE Evaluating Exponential and Logarithmic Expressions Evaluate the following expressions. Round your answers to three decimal places. (a) log 23 (b) 102.6
y = abxExponential Model log y = log (abx)Take the common logarithm of both sides log y = log a + log bx log y = log a + x log b Y = A + B x where b = 10Ba = 10A
EXAMPLE 4 Finding the Curve of Best Fit to an Exponential Model Day Weight (in grams) 0 1000.0 1 897.1 2 802.5 3 719.8 4 651.1 5 583.4 6 521.7 7 468.3 A chemist as a 1000-gram sample of a radioactive material. She records the amount of radioactive material remaining in the sample every day for a week and obtains the following data.
(a) Draw a scatter diagram of the data treating the day, x, as the predictor variable. (b) Determine Y = log y and draw a scatter diagram treating the day, x, as the predictor variable and Y = log y as the response variable. Comment on the shape of the scatter diagram. (c) Find the least-squares regression line of the transformed data. (d) Determine the exponential equation of best fit and graph it on the scatter diagram obtained in part (a). (e) Use the exponential equation of best fit to predict the amount of radioactive material is left after 8 days.
y = axb Power Model log y = log (axb) Take the common logarithm of both sides log y = log a + log xb log y = log a + b log x Y = A + bX where a = 10A
Distance Intensity 1.0 0.0972 1.1 0.0804 1.2 0.0674 1.3 0.0572 1.4 0.0495 1.5 0.0433 1.6 0.0384 1.7 0.0339 1.8 0.0294 1.9 0.0268 2.0 0.0224 EXAMPLE Finding the Curve of Best Fit to a Power Model Cathy wishes to measure the relation between a light bulb’s intensity and the distance from some light source. She measures a 40-watt light bulb’s intensity 1 meter from the bulb and at 0.1-meter intervals up to 2 meters from the bulb and obtains the following data.
(a) Draw a scatter diagram of the data treating the distance, x, as the predictor variable. (b) Determine X = log x and Y = log y and draw a scatter diagram treating the day, X = log x, as the predictor variable and Y = log y as the response variable. Comment on the shape of the scatter diagram. (c) Find the least-squares regression line of the transformed data. (d) Determine the power equation of best fit and graph it on the scatter diagram obtained in part (a). (e) Use the power equation of best fit to predict the intensity of the light if you stand 2.3 meters away from the bulb.
Modeling is not only a science but also an art form. Selecting an appropriate model requires experience and skill in the field in which you are modeling. For example, knowledge of economics is imperative when trying to determine a model to predict unemployment. The main reason for this is that there are theories in the field that can help the modeler to select appropriate relations and variables.