Analyzing Two-Way Tables for Categorical Variables
180 likes | 219 Vues
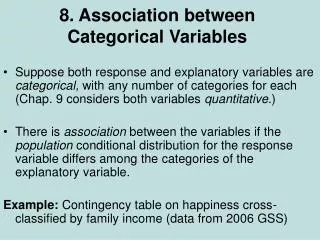
Learn to interpret two-way tables, compute marginal frequencies, and calculate relative frequencies for effective data analysis. Study association between categories using conditional probabilities.

Analyzing Two-Way Tables for Categorical Variables
E N D
Presentation Transcript
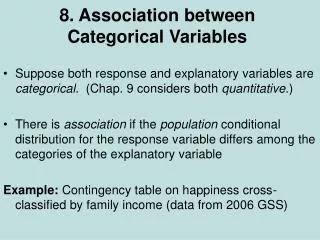
Two Way Tables Relationship between Two Categorical Variables
A two-way table is a useful way to organize data that can be categorized by two variables. This is also call a contingency table. The joint frequencies are the counts in the body of the table. 24, 12, 14, 16, 13, & 21 are joint frequencies.
The total frequency for any row or column is called a marginal frequencies. 50, 50, 40, 25, & 35 are marginal frequencies.
Find the marginal frequencies. 72 74 65 59 211 112 40
The frequency table can be easily changed to show relative frequencies by finding the ratios of each cell’s frequency to the total. To calculate relative frequency, divide each count in the frequency table by the overall total.
Find the Relative Frequencies. 72 /211 /211 /211 /211 /211 /211 /211 74 /211 /211 /211 /211 65 /211 59 211 112 40 /211 /211 /211 /211
Find the Relative Frequencies. 0.34 0.11 0.09 0.15 0.18 0.08 0.09 0.35 0.20 0.08 0.03 0.31 0.53 0.19 0.28 1.00
Relative Frequency 0.34 0.11 0.09 0.15 0.18 0.08 0.09 0.35 0.20 0.08 0.03 0.31 0.53 0.19 0.28 1.00 Do more 10th graders choose popularity or sports? Sports
Relative Frequency 0.34 0.11 0.09 0.15 0.18 0.08 0.09 0.35 0.20 0.08 0.03 0.31 0.53 0.19 0.28 1.00 Which grade had the greatest response that grades were the most important? 11th Grade
Relative Frequency 0.34 0.11 0.09 0.15 0.18 0.08 0.09 0.35 0.20 0.08 0.03 0.31 0.53 0.19 0.28 1.00 Which grade had the most overall students respond? 10th Grade
Suppose you asked 20 children and adults whether they liked broccoli. The table shows one way to arrange the data. The joint relative frequencies are the values in each category divided by the total number of values, shown by the shaded cells in the table. Each value is divided by 20, the total number of individuals.
The marginal relative frequencies are found by adding the joint relative frequencies in each row and column.
To find a conditional relative frequency , divide the joint relative frequency by the marginal relative frequency. Conditional relative frequencies can be used to find conditional probabilities.
In a poll, 150 students (75 boys and 75 girls) were asked if they prefer board games or video games. The data are shown in the two-way frequency table. Based on the table, use conditional relative frequency to find which statement best describes the association between gender and game preference? Which statements are true? a. Girls are more likely than boys to prefer board games. b. Girls are more likely to prefer board games to video games. c. Boys are more likely than girls to prefer board games. d. Boys are more likely to prefer board games to video games. 53/75=0.71 22/75=0.29 32/75=0.43 43/75=0.57 A
At a juice-bottling factory, quality-control technicians randomly select bottles and mark them pass or fail. The manager randomly selects the results of 50 tests and organizes the data by shift and result. The table below shows these results.
Pass Fail Total Morn. 0.28 0.1 0.38 After. 0.2 0.08 0.28 Eve. 0.22 0.12 0.34 Total 0.7 0.3 1 1. Make a table of the joint and marginal relative frequencies.
0.08 ≈ 0.27 0.3 Pass Fail Total Morn. 0.28 0.1 0.38 After. 0.2 0.08 0.28 Eve. 0.22 0.12 0.34 Total 0.7 0.3 1 Find the probability that a bottle was inspected in the afternoon given that it failed the inspection.
Two Way Tables Relationship between Two Categorical Variables