Testing for a Relationship Between 2 Categorical Variables
160 likes | 319 Vues
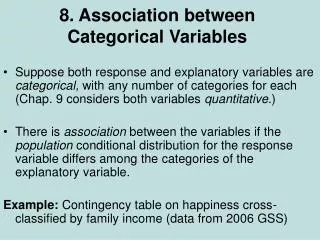
Testing for a Relationship Between 2 Categorical Variables. The Chi-Square Test …. Rel’nship between owning a bike and having a significant other?. Rows: Bike Columns: SigOther No Yes All No 37 27 64 57.81 42.19 100.00

Testing for a Relationship Between 2 Categorical Variables
E N D
Presentation Transcript
Testing for a Relationship Between 2 Categorical Variables The Chi-Square Test …
Rel’nship between owning a bike and having a significant other? Rows: Bike Columns: SigOther No Yes All No 37 27 64 57.81 42.19 100.00 Yes 10 18 28 35.71 64.29 100.00 All 47 45 92 51.09 48.91 100.00 Cell Contents -- Count % of Row
Our Hypotheses • If there is no relationship, we’d expect the percentages (proportions) in each group to be equal. So: • H0: There is no relationship between owning a bike and having a significant other. Or, pN = pY. • HA: There is a relationship. Or, pN pY.
What would the table look like if there was no relationship? Rows: Bike Columns: SigOther No Yes All No 37 27 64 Yes 10 18 28 All 47 45 92 Cell Contents -- Observed Counts 45/92, or 48.9%, would have an SO regardless of owning a bike. 64-31.3 32.7 31.3 So, 0.489(64), or 31.3, non-bikers would have SO. 14.3 13.7 28-13.7 And, 0.489(28), or 13.7, bikers would have SO. ExpectedCounts
Calculate (observed - expected)2/expected for each of the cells. Are observed counts very different from expected counts? For first cell: (37 - 32.7)2/32.7 = 0.565 For second cell: (27 - 31.3)2/31.3 = 0.591 For third cell: (10 - 14.3)2/14.3 = 1.293 For fourth cell: (18 - 13.7)2/13.7 = 1.350
Add up the resulting quantities to get the value of the “chi-square statistic” for the table. Are observed counts very different from expected counts? Chi-square statistic = 0.565 + 0.591 + 1.293 + 1.350 = 3.80 If the chi-square statistic is large, then the observed counts are very different than the counts we’d expect to get if there is no relationship.
The P-value • How likely is it that we’d get a chi-square statistic as large as we did if the proportions are equal? • The chi-square statistic follows the chi-square distribution with (r-1)(c-1) degrees of freedom, where r and c are the number of rows and columns, respectively, in the table. • We’ll let Minitab calculate the P-value.
Rel’nship between owning a bike and having a significant other? Rows: Bike Columns: SigOther No Yes All No 37 27 64 32.70 31.30 64.00 Yes 10 18 28 14.30 13.70 28.00 All 47 45 92 47.00 45.00 92.00 Chi-Square = 3.807, DF = 1, P-Value = 0.051 Cell Contents -- Count Exp Freq DF= (2-1)(2-1) = 1
Chi-Square Test in Minitab when data are notsummarized • Select Stat >> Tables >> Cross Tabulation • Select two Classification Variables. The first (second) variable you select will be the row (column) variable. • Under Display, select what you want shown--perhaps, counts and row percents. • Click on box labeled Chi-Square Analysis. • Select OK.
Chi-Square Test in Minitab when data are summarized • Enter observed counts in table format. • Select Stat >> Tables >> Chi-Square Test • Specify the columns containing the table. • Select OK.
Miscellaneous issues • Relationship of chi-square test to Z test • Significant relationships not necessarily true relationships. • Assumptions
Rel’nship between owning a bike and having a significant other? Success = Having Significant Other Bike X N Sample p No 27 64 0.421875 Yes 18 28 0.642857 Estimate for p(No) - p(Yes): -0.220982 95% CI for p(No) - p(Yes): (-0.435780, -0.00618412) Test for p(No) - p(Yes) = 0 (vs not = 0): Z = -1.95 P-Value = 0.051
Relationship between Z test and chi-square test • Two-tailed Z-test for two proportions (using a pooled estimate of p) and a chi-square test for a 2-by-2 table will give exactly same P-value. • Use Z-test for one-tailed tests (to see if one proportion is larger than other.) • Use chi-square test for two-tailed tests and for larger than 2-by-2 tables.
Rel’nship between owning bike and having a significant other? Rows: bike Columns: steady No Yes All No 67 49 116 57.76 42.24 100.00 Yes 33 26 59 55.93 44.07 100.00 All 100 75 175 57.14 42.86 100.00 100 75 175 Chi-Square = 0.053, DF = 1, P-Value = 0.817 Cell Contents -- Count % of Row Using Fall 1998 data, conclude no relationship.
If test suggests relationship exists... • Is there a reasonable explanation for a relationship? • If not, consider possibility of having made a Type I error. • If so, collect data on another random sample and see if new data suggest relationship. If so, start believing it … but still go collect more data …
Ah, those darn assumptions ... • P-value will only be accurate if you have large enough sample. • “Large enough” here means: • no cells have an expected count less than 1 • no more than 20% of the cells have an expected count less than 5 (in a 2-by-2, means no cells). • Minitab will print a warning if assumptions are violated.