Download
1 / 34
390 likes | 688 Vues
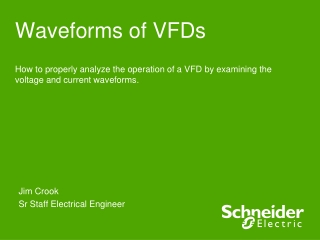
Waveforms of VFDs. How to properly analyze the operation of a VFD by examining the voltage and current waveforms. Jim Crook Sr Staff Electrical Engineer. Overall Principles. Current always goes in a closed loop . We should always look for the path back to the source

E N D
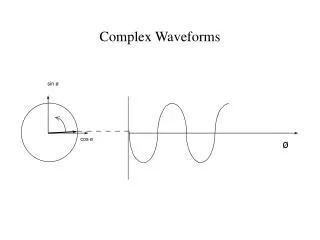
Waveforms of VFDs How to properly analyze the operation of a VFD by examining the voltage and current waveforms. Jim Crook Sr Staff Electrical Engineer
Overall Principles • Current always goes in a closed loop. • We should always look for the path back to the source • Voltages are always measured with respect to another portion of the circuit. • A picture is worth a thousand words (approximately)
Four areas of VFD Measurements • Input side • DC bus • Output side • Controls and Communications
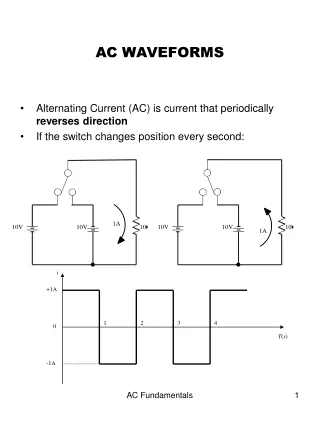
Typical Mains Topology: Solidly grounded Neutral • TN-Earthing (Grounding) System: Protective Earth (PE) Neutral (N) are Separate conductors They are connected together only near the power source. L1 L2 L3 N PE 3 Phase transformer secondary WYE connected With Neutral Grounded PE N L1 L2 L3
Simulation of 15 HP 460 V, 22 kA Prospective Short Circuit Current.
Input Current, Line 1 • The current is a double pulse pattern. It only flows when the input voltage is higher than the dc bus.
Input Current, Line 1, Line 2, and Line 3 • There are six pulses per cycle, two from each phase.
Data Bulletin 8800DB0801 • The Effects of Available Short-Circuit Current on AC Drives
100 kA Prospective Short Circuit Current, but added line reactor
100 kA Prospective Short Circuit Current, but added dc choke
Drive with large dc choke. The line currents have a leading edge and the current does not go to zero in the middle.
Single Phase Input Current • The current is a single pulse pattern. When rectified it has 8.33 ms between pulses.
Single Phase to 3 Phase comparison • Single Phase • Peak Current 230 A, about 2.5 times higher! • Time between pulses is 8.333 ms • DC bus ripple 110 V peak to valley. • Three Phase • Peak current 90 A • Time between pulses is 2.777 ms • DC bus ripple 20 V peak to valley Single Phase input requires at least double sizing the drive to handle the higher input current and DC bus ripple. Some 480 V drives require adding additional capacitance plus double sizing the drive. Line reactors reduce the peak current; but also reduces bus V.
3 phase Input Voltage, Line 1 to Line 2. • The bumps are from the current peaks drawn by the drive. It is still basically sinusoidal, with peak voltages 650 V or higher.
Input Voltage, Line 1 to Line 2. Line resistance increased to 0.25 Ohms (for this chart only). This causes “Flat-Topping” • Peaks have been flattened by a voltage drop across the series impedance. • Voltage Distortion. • Causes Low dc bus voltage, and low motor voltage at full speed.
Input Voltage, Line 1 to Ground, 277 V,22 kA PSCC • The bumps are from the current peaks drawn by the drive. It is still basically sinusoidal.
DC Bus voltage, Zoomed in The dc bus charges up to the peak of the line to line voltage. When the current stops, the dc bus supplies the energy until the next current pulse comes.
Single Phase input: DC Bus Voltage.Note the ripple is much larger. More capacitance is needed by about 2 to 3 times.
DC bus voltage with respect to ground. • The dc bus floats up and down with the average summation of the conducting phases. • The negative bus is NOT at ground.
Mains Topology • Corner grounded -System: • This system still used in the U.S.It is not allowed for Y-range Altivar drives ! L1 L2 L3 PE L1 L2 L3
DC bus voltage with respect to ground, Corner grounded Delta. • The dc bus floats up and down with the average summation of the conducting phases. • The negative bus is NOT at ground. • This also causes more capacitive current on the motor leads.
DC bus voltage with respect to ground, High Leg Delta. • The dc bus floats up and down with the average summation of the conducting phases. • The negative bus is NOT at ground. • This also causes more capacitive current on the motor leads.
PWM waveform In this 460 V ac drive, the Pulse Width Modulated waveforms go from 0 to 650 V dc in a microsecond or less. These fast rise and fall times (high dV/dt) have a lot of high frequency content. This could cause EMI if the motor is not grounded well.
Live Demo • We will use the Pico Scope 2204 oscilloscope for the projector display. • Current Probe is Tektronix A621 or A622. • Voltage Probe is Tektronix P5200, differential and isolated. • Battery scopes are Tektronix 720P and Fluke.