Separating Signal from Noise: PK/PD modelling of QT-interval prolongation Anne Chain 1 , Lutz Harnisch 2 & Oscar De
10 likes | 179 Vues
Power calculations were performed using the following equation, with effect size fixed to 10 ms, to fit simulated datasets with varying population size (N) from the final model. .

Separating Signal from Noise: PK/PD modelling of QT-interval prolongation Anne Chain 1 , Lutz Harnisch 2 & Oscar De
E N D
Presentation Transcript
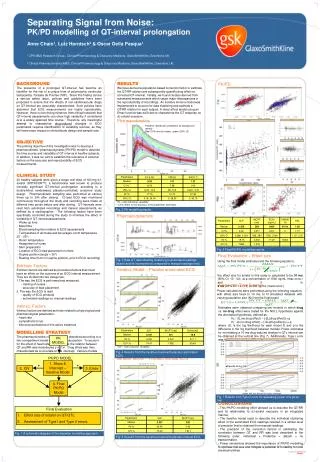
Power calculations were performed using the following equation, with effect size fixed to 10 ms, to fit simulated datasets with varying population size (N) from the final model. Estimates were obtained comparing two models in which drug vs. no drug effect were tested for the NULL hypothesis against the alternative hypothesis, defined as: HO: -2L(no drug effect) – {-2L(drug effect)} <q H1: -2L(no drug effect) – {-2L(drug effect)} >=q where -2L is the log likelihood for each model fit and q is the difference in the log likelihood between models. Power estimates for not missing a 10 ms drug-induced change in QTc interval can be obtained at the vertical line (Fig 7). Additionally, Type I error was found to be less than 5%. 1. Slope & Intercept – Iterative Model + + 2. IOV 3. Emax 4. Final PK/PD Model Final Evaluation • Effect size of sotalol on QT/QTc. • Assessment of Type I and Type II errors. Separating Signal from Noise:PK/PD modelling of QT-interval prolongation Anne Chain1, Lutz Harnisch2 & Oscar Della Pasqua1 1 CPK M&S Research Group , Clinical Pharmacology & Discovery Medicine, GlaxoSmithKline, Greenford, UK. 2 Clinical Pharmacokinetics M&S, Clinical Pharmacology & Discovery Medicine, GlaxoSmithKline, Greenford, UK. • BACKGROUND The presence of a prolonged QT-interval has become an identifier for the risk of a unique from of polymorphic ventricular tachycardia, Torsade de Pointes (TdP). Since this finding can be a serious safety issue, policies and guidelines have been proposed to ensure that the effects of non-cardiovascular drugs on QT-interval are accurately characterised. Such policies have assumed that ECG measurements are highly reproducible. However, there is convincing evidence from clinical research that QT-interval assessments can show high variability if considered over a widely spanned time course. Therefore, any meaningful attempt to characterise drug-induced changes in ECG parameters requires identification of variability sources, as they will have major impact on clinical study design and sample size. • OBJECTIVE The primary objective of this investigation was to develop a pharmacokinetic / pharmacodynamic (PK/PD) model to describe the time course and variability of QT-interval in healthy subjects. In addition, it was our aim to establish the relevance of external factors on the accuracy and reproducibility of ECG measurements. • CLINICAL STUDY • 30 healthy subjects were given a single oral dose of 160 mg d,l-sotalol (SOTACORTM), a beta-blocker well known to produce clinically significant QT-interval prolongation, according to a double-blind, randomised, placebo-controlled, crossover study design. Pharmacokinetic sampling was performed at various times up to 24h after dosing. 12-lead ECG was monitored continuously throughout the study and recording were made at different time points before and after dosing. QT-intervals were read from automated recordings and manual assessments, as defined by a cardiographer. The following factors have been specifically controlled during the study to minimise the effect of variability of QT-interval assessments: • - Wake-up time • - Meal time • - Blood sampling time relative to ECG assessments • - Temperature of all meals and beverages (room temperature 20° - 25°) • - Room temperature • - Assignment of nurse • - Skin preparation • - Location of ECG lead placement on chest • - Supine position (angle = 35°) • - Resting time (5 min in supine position, prior to ECG recording) • Extrinsic Factors • Extrinsic factors are defined as procedural factors that could have an effect on the outcome of an ECG interval measurement. They are divided into two categories: • The way the ECG is performed and measured. • - training of nurses • - accuracy of lead placement • 2. The way the ECG is read. • - quality of ECG printouts • - automated readings vs. manual readings • Intrinsic Factors • Intrinsic factors are defined as those related to physiological and pharmacological parameters: • - heart rate • - sympathetic tonus • - blood concentrations of the active treatment • MODELLING STRATEGY • The pharmacokinetics of d,l-sotalol was described according to a two-compartment model with first order absorption. To account for the effect of heart rate on QT-interval, the relation between QT and RR was modelled as y = b*xa. Drug effect was then characterised as a covariate on the intercept. Various models were explored to define the underlying exposure-response relation for d,l-sotalol. Data analysis was based on non-linear mixed effects modelling (NONMEM V5.1) RESULTS We have derived a population-based correction factor to estimate the QT/RR relation and subsequently quantify drug effect on corrected QT-interval. Initially, we found clusters derived from automated measurements which cause major discrepancies in the reproducibility of recordings. An iterative mixture model was implemented to account for data clustering and estimate a QT/RR relation for each subject. A direct effect model using an Emax function was sufficient to characterise the QT response on d,l-sotalol exposure. Pharmacokinetics PK/PD Posterior distribution presented as background density Red (10% around mean), green (95% CI) *IIV – Inter-individual variability. ** CV% refers to the accuracy of the parameter estimates. Fig. 2 PK modelling results. Pharmacodynamics Fig. 6 Final PK/PD modelling results. Final Evaluation – Effect size Using the final model estimates and the following equation, the effect size for sotalol in this study is calculated to be 31 ms (95% CI: 13 - 54) at a concentration of 1500 ng/mL (max conc.) and it is 6 ms (95% CI: 1.2 - 18) at 500 ng/mL (mean conc.). Fig. 3 Raw QT data showing clustering in automated readings (black) and its inconsistency compared to manual readings (red). Iterative Model – Placebo automated ECG Type I and Type II errors PK MODEL *IOV – Inter-occasion variability. Fig. 4 Results from the iterative model with placebo automated ECG. Iterative Model – Placebo manual ECG PK/PD MODEL qΧ2(p=0.99, df=3) = 11.3 Fig. 7 Results from Type II error for assessing power of a given trial. • CONCLUSIONS • This PK/PD modelling effort allowed us to describe the QT/RR and its relationship to d,l-sotalol exposure in an integrated manner. • The iterative model used to describe the individual clustering effect in the automated ECG readings resulted in a similar level of precision that is obtained from manual readings. • The precision of the correction factors in estimating the correlation between QT and RR was best described in the following order: individual > Fridericia > Bazett > no transformation. • Power simulations showed the importance of PK/PD modelling to optimise trial size and mitigate a potential QTc liability for new chemical entities. Fig. 1 A schematic diagram of the stepwise modelling approach. Fig. 5 Results from the iterative model with placebo manual ECG.