Download
1 / 65
650 likes | 894 Vues
Signal and Noise in fMRI. fMRI Graduate Course October 16, 2002. What is signal? What is noise?. Signal, literally defined Amount of current in receiver coil What can we control? Scanner properties (e.g., field strength) Experimental task timing Subject compliance (through training)

E N D
Signal and Noise in fMRI fMRI Graduate Course October 16, 2002
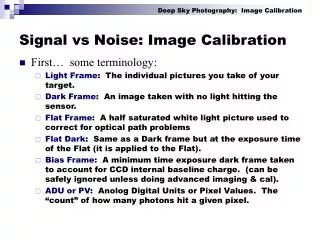
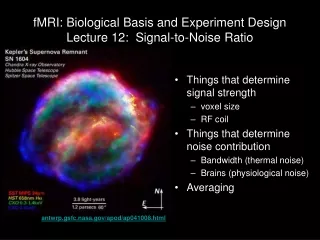
What is signal? What is noise? • Signal, literally defined • Amount of current in receiver coil • What can we control? • Scanner properties (e.g., field strength) • Experimental task timing • Subject compliance (through training) • Head motion (to some degree) • What can’t we control? • Scanner-related noise • Physiologic variation (e.g., heart rate) • Some head motion • Differences across subjects
Signal, noise, and the General Linear Model Amplitude (solve for) Measured Data Noise Design Model Cf. Boynton et al., 1996
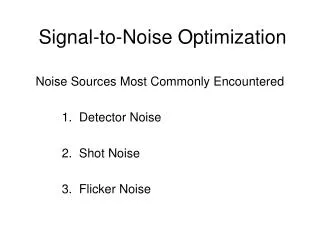
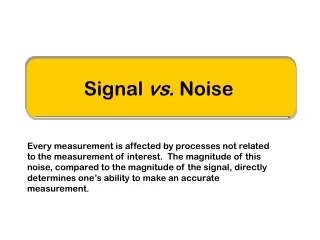
Signal-Noise-Ratio (SNR) Task-Related Variability Non-task-related Variability
Effects of SNR: Simulation Data • Hemodynamic response • Unit amplitude • Flat prestimulus baseline • Gaussian Noise • Temporally uncorrelated (white) • Noise assumed to be constant over epoch • SNR varied across simulations • Max: 2.0, Min: 0.125
What are typical SNRs for fMRI data? • Signal amplitude • MR units: 5-10 units (baseline: ~700) • Percent signal change: 0.5-2% • Noise amplitude • MR units: 10-50 • Percent signal change: 0.5-5% • SNR range • Total range: 0.1 to 4.0 • Typical: 0.2 – 0.5
Trial Averaging • Static signal, variable noise • Assumes that the MR data recorded on each trial are composed of a signal + (random) noise • Effects of averaging • Signal is present on every trial, so it remains constant through averaging • Noise randomly varies across trials, so it decreases with averaging • Thus, SNR increases with averaging
Example of Trial Averaging Average of 16 trials with SNR = 0.6
Fundamental Rule of SNR For Gaussian noise, experimental power increases with the square root of the number of observations
Increasing Power increases Spatial Extent Subject 1 Subject 2 Trials Averaged 4 500 ms 500 ms 16 … 36 16-20 s 64 100 144
Effects of Signal-Noise Ratio on extent of activation: Empirical Data Subject 1 Subject 2 Number of Significant Voxels VN = Vmax[1 - e(-0.016 * N)] Number of Trials Averaged
1000 Voxels, 100 Active Active Voxel Simulation Signal + Noise (SNR = 1.0) • Signal waveform taken from observed data. • Signal amplitude distribution: Gamma (observed). • Assumed Gaussian white noise. Noise
Effects of Signal-Noise Ratio on extent of activation:Simulation Data SNR = 1.00 SNR = 0.52 (Young) Number of Activated Voxels SNR = 0.35 (Old) SNR = 0.25 SNR = 0.15 SNR = 0.10 Number of Trials Averaged
Variability Across Subjects D’Esposito et al., 1999
Implications of Inter-Subject Variability • Use of individual subject’s hemodynamic responses • Corrects for differences in latency/shape • Suggests iterative HDR analysis • Initial analyses use canonical HDR • Functional ROIs drawn, interrogated for new HDR • Repeat until convergence • Requires appropriate statistical measures • Random effects analyses • Use statistical tests across subjects as dependent measure (rather than averaged data)
Where are partial volume effects most problematic? • Ventricles • Grey / white boundary • Blood vessels
Activation Profiles Gray / White Ventricle Gray / White White Matter Ventricle
What causes variation in MR signal? • Field strength • Excitation vs. Inhibition • Large vessel effects • Differences across the brain • Timing of cognitive processes