Download
1 / 24
240 likes | 479 Vues
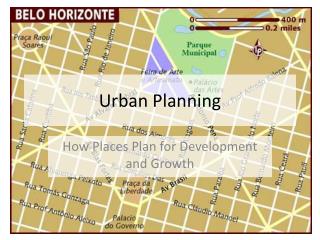
Urban Induced Precipitation Changes: Implications for Regional Planning. Erica Betts April 24, 2008. Scientists vs. Planners. Scientists Producers of scientific knowledge Planners Linking knowledge to action. Urbanization – Climate Feedbacks. Urban Heat Island (UHI)

E N D
Urban Induced Precipitation Changes:Implications for Regional Planning Erica Betts April 24, 2008
Scientists vs. Planners • Scientists • Producers of scientific knowledge • Planners • Linking knowledge to action
Urbanization – Climate Feedbacks • Urban Heat Island (UHI) • Land use changes – climate feedbacks • Surface albedo changes • Changes in latent vs. sensible heat flux • Boundary layer changes due to building height • Coceal and Belcher – urban canopy modeling efforts • Precipitation changes • Urban areas cause surface winds to decrease under significant synoptic flow and increase under weak synoptic flow due to surface roughness
Implications/Importance • Urban areas account for less than 2% of the Earth’s land surface • Feedbacks more a local and regional issue rather than global • More than 50% of the Earth’s population lives in these urbanized areas
Various scales linking urban environments to the environmental system [modified after Oke ( 1987)] urban canopy layer (UCL) urban boundary layer (UBL).
Urban-Induced Precipitation Changes • Long held realization that change from naturally vegetated to urban environments results in temperature changes • Precipitation changes have been witnessed as well but harder to analyze until later part of this century • Many questions remain concerning what factors/mechanisms drive these precipitation changes and/or their relative importance.
19.5% increase in precipitation downwind of Atlanta when compared with upwind control. During warm seasons 1998-2000 Shepherd, J. M., et al. (2002), Rainfall Modification by Major Urban Areas: Observations from Spaceborne Rain Radar on the TRMM Satellite, Journal of Applied Meteorology, 41, 689-701.
Urban-Induced Precipitation Changes • Urban-induced changes in natural precipitation likely due to: • Atmospheric destabilization due to UHI-thermal perturbation of the boundary layer • Increased low-level convergence due to surface roughness • Modification of microphysical and dynamic processes by the addition of cloud condensation nuclei • Modification of low-level atmospheric moisture content by additions from urban industrial sources and/or irrigation practices • Bifurcated or diverting of precipitation systems by the urban canopy or related processes
http://www.gsfc.nasa.gov/gsfc/earth/pictures/20020613urbanrain/Urban%20Heat%20Island.mpghttp://www.gsfc.nasa.gov/gsfc/earth/pictures/20020613urbanrain/Urban%20Heat%20Island.mpg
Urban Heat Island • UHI-induced precipitation events have been found to occur when atmosphere is only marginally unstable • Too stable, no convection occurs • Too unstable, widespread convection occurs regardless of urban influence
Typical rural and urban surface energy balance. The values are in units of kW h m2 day−1 (courtesy of R. Sass, Rice University, online at http:// www.ruf.rice.edu/∼sass/UHI.html). QSW = net shortwave irradiance QLW = net longwave irradiance QSH = surface sensible heat flux QLE = latent turbulent heat flux QA = anthropogenic heat input QG = ground heat conduction QSW + QLW + QSH + QLE + QG + QA = 0 Shepherd, J. M. (2005), A Review of Current Investigation or Urban-induced rainfall and recommendations for the future,Earth Interactions, 9(12), 1-27.
Wind speed, cloudiness, and relative humidity are negatively correlated with the maximum UHI intensity
Cloud Condensation Nuclei • Increased precipitation downwind of urban areas due to the influx of CCN • Increased CCN from pollution creates a greater number of small droplets but less coalescence and drop formation. Droplets do not become large enough to fall as rain.
(left) Satellite-retrieved median effective radius of particles near the top of deep convective clouds at various stages of their vertical development, as a function of the cloud-top temperature, which serves as a surrogate for cloud-top height. The effective radius is the ratio of the integral of the third moment (r3) of the radius, weighted with the number concentration at that radius, to its second moment (r2). This is shown for clouds forming in polluted (solid lines) and pristine air (broken lines). The red lines denoted by “INDOEX polluted” are for data along a track that runs from southwestern India into the Indian Ocean. The blue lines are for tracks over urban southeastern Australia. Violet lines are for Thailand premonsoon clouds with suppressed coalescence. Green lines are for biomass smoke over the Amazon. Black lines are for desert dust over Israel. The vertical green line denotes the 14-μm precipitation threshold radius (following Ramanathan et al. 2001). (right) TRMM satellite data near Australia showing rainfall suppression by biomass burning and smoke (yellow). Area 3 is characterized by no aerosol contamination and rainfall (white) (following Rosenfeld 2000).
Questions for Planners • How much does UHI-induced precipitation vary from natural precipitation patterns (quantity, severity) • Impacts on built environment • At what level of density or development do these impacts start to be felt? Do they continue to increase? Are they uniform across climate regions? • At what size or density will a city have to begin addressing possible impacts from UHI or urban influenced precipitation changes? • At what point in the future will impacts stop being purely a local phenomenon? • Megaregions
UHI-initiated precipitation events plotted by location of storm center overlaid on counties, limited-access highways, and a buffer around the highways. Dixon, P. G., and T. L. Mote (2003), Patterns and Causes of Atlanta's Urban Heat Island-Initiated Precipitation, Journal of Applied Meteorology, 42(9), 1273.
Questions of Interest to Climate Scientists • Most studies focus on one city. • Comparisons across a number of cities may help in determining the relative impact of various processes or factors influencing UHI-induced precipitation • Identification of magnitude of precipitation changes • Historical or trend analysis of regional precipitation patterns may be enhanced by a treatment of change attributed to UHI-effects as opposed to larger climate changes
Proposed Research • Dixon and Mote (2003) developed methodology for isolating UHI-induced precipitation events • Incorporated spatial synoptic classification method • Based on surface based observations of • Temperature • dew point • Wind • Pressure • cloud cover
Dixon and Mote (2003), found that UHI-induced precipitation soundings showed much higher dew points (as much as 5°C) below 550 hPa than average days. • Airmass analysis showed that these events were more frequent under the most humid air masses rather than the ones with the greatest UHI-intensities. The difference in sounding values (temperature and dewpoint) between the average UHI-induced precipitation event and the total study period.
Proposed Research Stone, B., Jr. (2007), Urban and rural temperature trends in proximity to large US cities: 1951-2000, International Journal of Climatology, 27, 1801-1807.